MANHATTAN NEW DEVELOPMENT MARKET REPORT

MANHATTAN NEW DEVELOPMENT MARKET REPORT ARCHIVE
sign up for Sponsor Sale reports to be sent to your email
TABLE OF CONTENTS
JUMP TO A PARTICULAR SECTION
INTRODUCTION
MNS IS PROUD TO PRESENT THE SECOND QUARTER OF 2024 EDITION OF OUR NEW DEVELOPMENT MARKET REPORT.
New Development Sales data, defined as “Arms-Length” first offering transactions where the seller is considered a “Sponsor”, was compiled from the Automated City Register Information System (ACRIS) for sponsor sales that traded during the second quarter of 2024 (04/01/24 – 06/30/24). All data summarized is on a median basis.
MARKET SNAPSHOT

5.9%
YEAR-OVER-YEAR
MEDIAN PPSF
2.5%
QUARTER-OVER-QUARTER
MEDIAN PPSF
4.5%
YEAR-OVER-YEAR
MEDIAN SALES PRICE
0.2%
QUARTER-OVER-QUARTER
MEDIAN SALES PRICE
MANHATTAN NEW DEVELOPMENT SPONSOR SALES
NEIGHBORHOOD WITH THE MOST NEW DEVELOPMENT SALES
UPPER WEST SIDE
21.39% of Manhattan New Dev Sales
TOTAL NEW DEVELOPMENT SALES VOLUME
$931,247,210 in 1Q24
LARGEST QUARTERLY UP-SWING
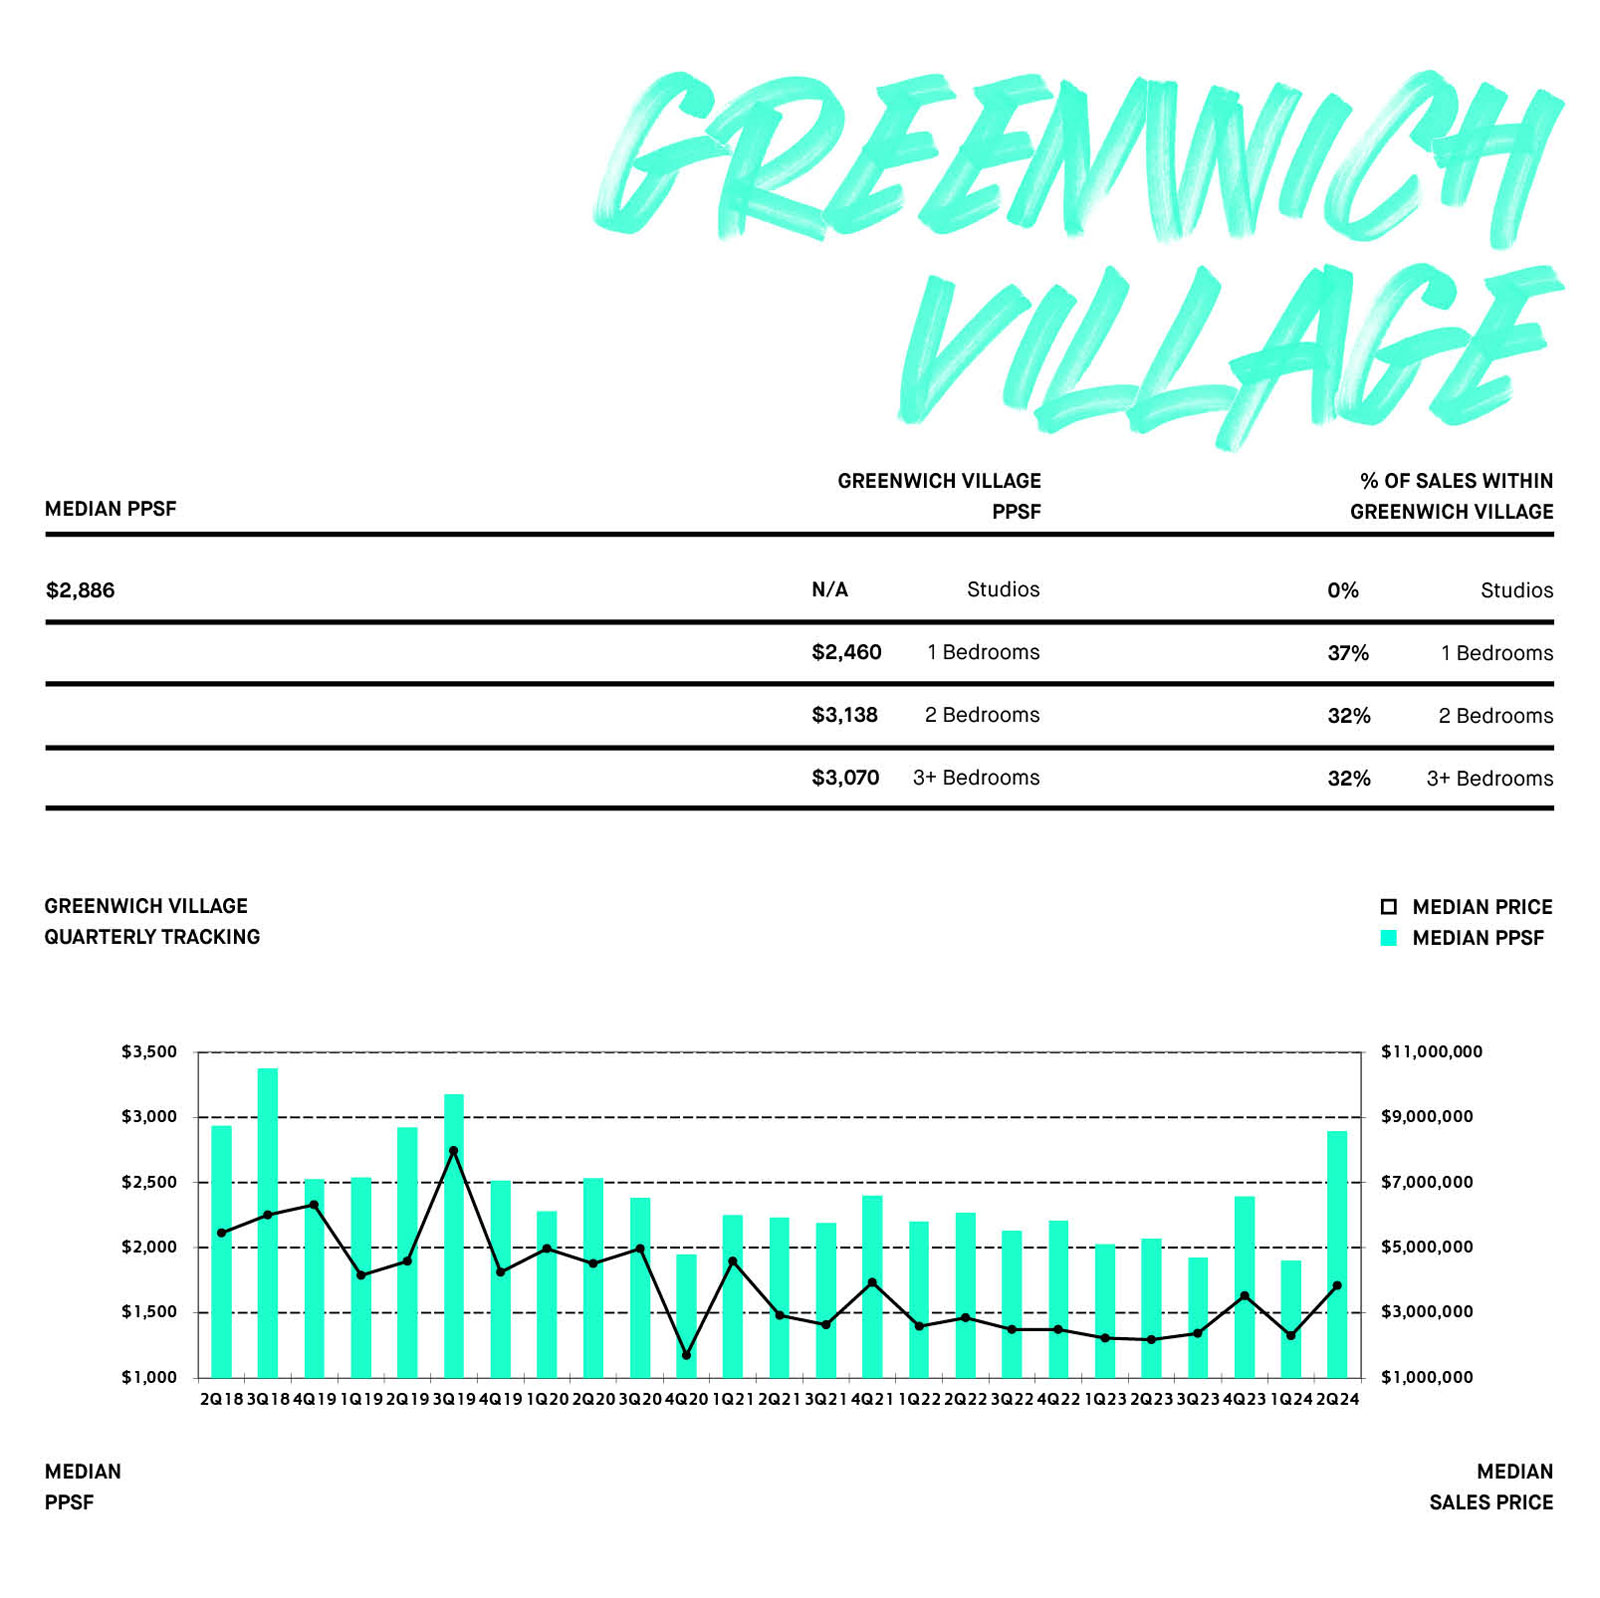
GREENWICH VILLAGE / WEST VILLAGE
PPSF $2,886/SF from $1,894/SF
Sales Price $3,851,800 from $2,295,000
LARGEST QUARTERLY DOWN-SWING
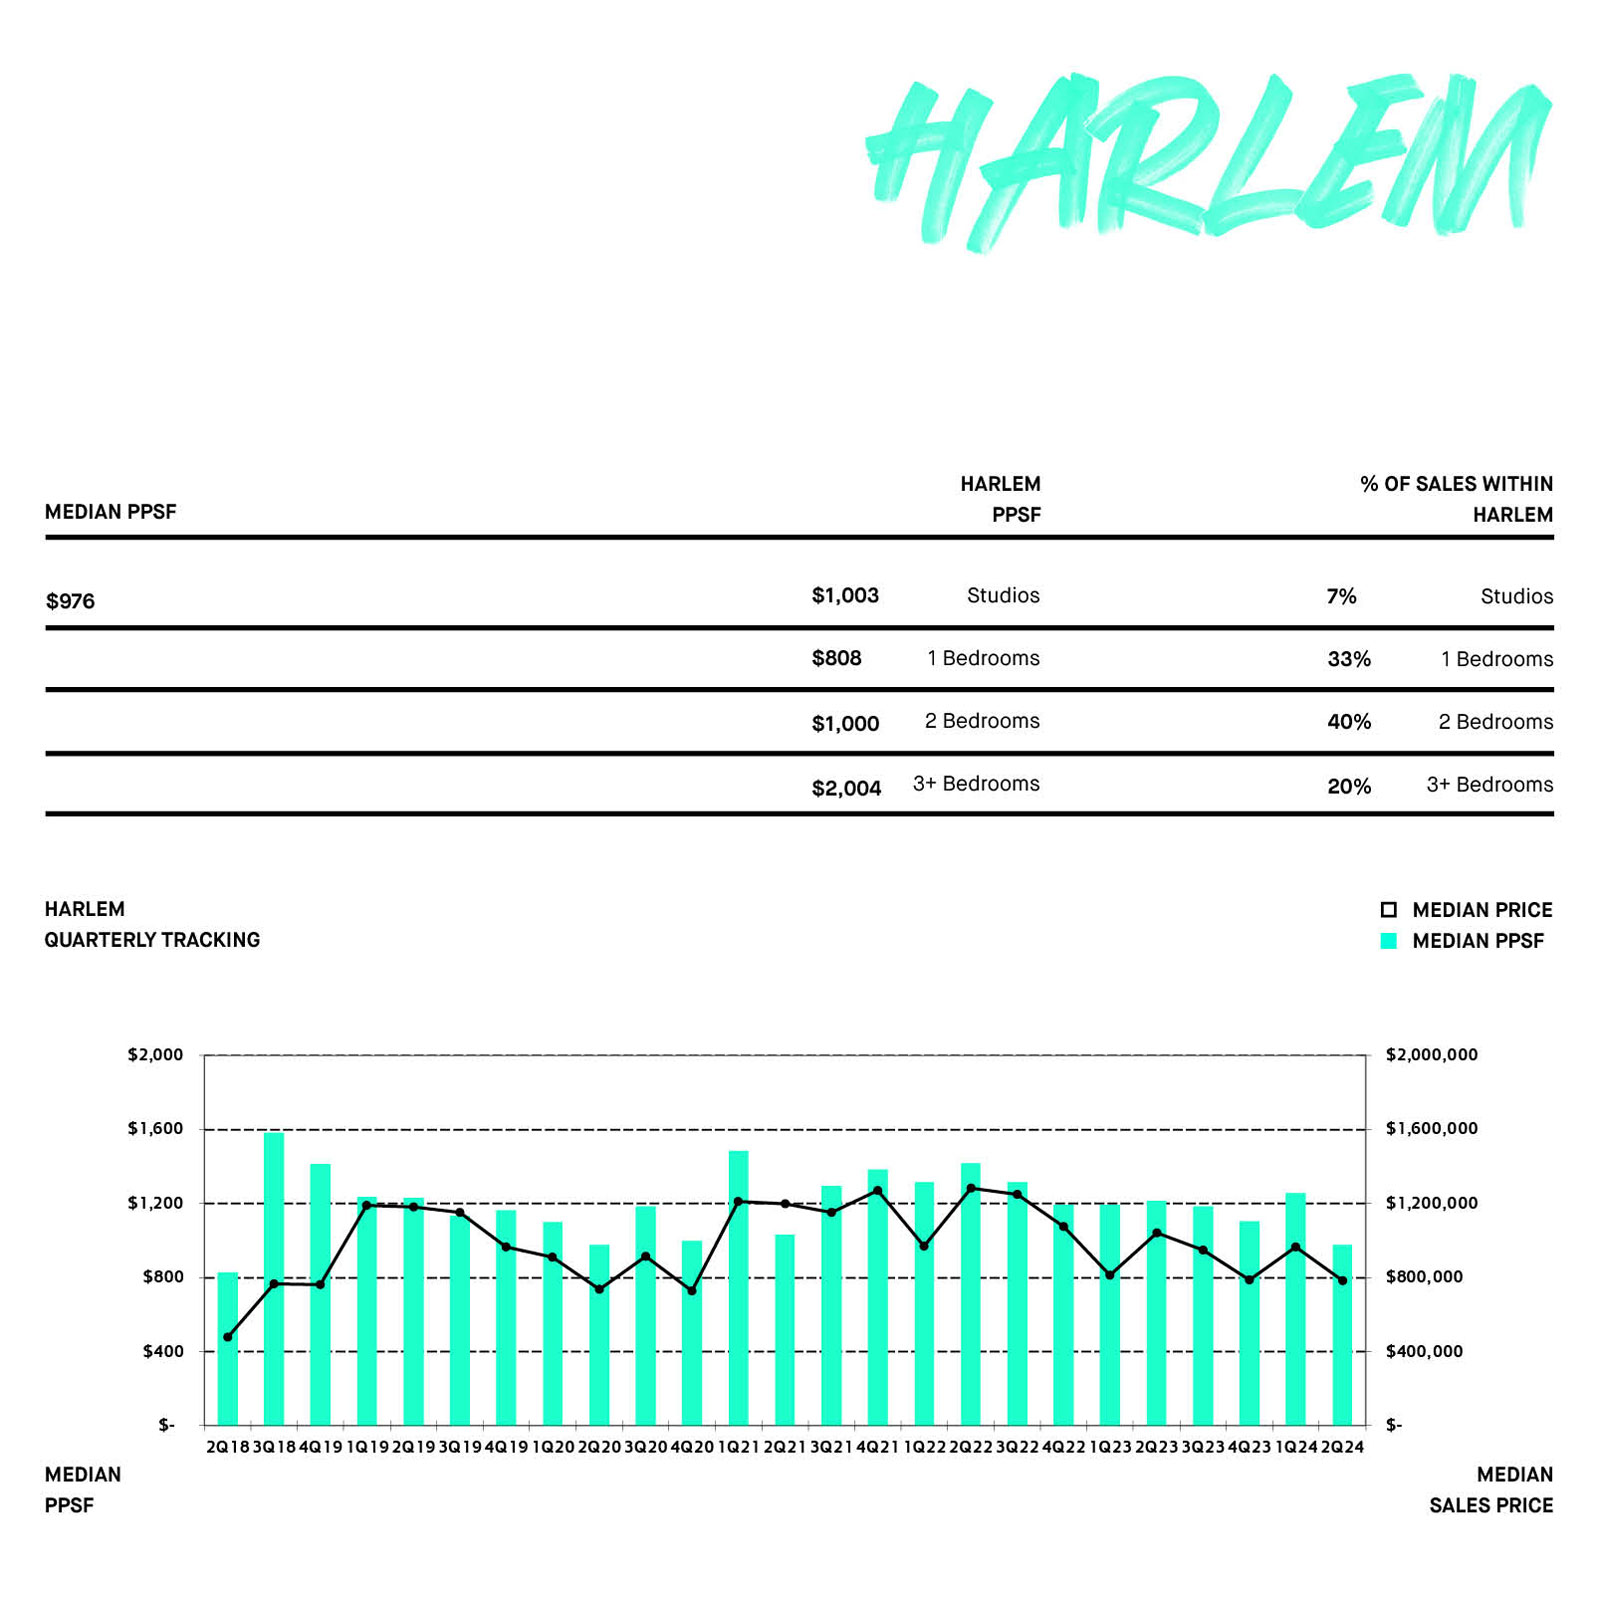
HARLEM
PPSF $976 from $1,254
Sales Price $784,053 from $965,000
HIGHEST NEW DEVELOPMENT SALE PPSF
220 CENTRAL PARK SOUTH 43B $10,845 PPSF
HIGHEST NEW DEVELOPMENT SALE
217 WEST 57TH STREET 107 $117,390,500
MARKET SNAPSHOT
MARKET SUMMARY
Quarter-over-quarter, the total number of sponsor sales in Manhattan increased by 30.43% from 276 sales during 1Q24 to 360 sales this past quarter. In that
same span, total sales volume increased by 41.63%, from $931,247,210 to $1,318,924,643. Quarter-over-quarter, the median price per square foot increased
by 2.52%, from $1,902 to $1,950, while the median sales price decreased by 0.16%, from $2,407,500 to $2,403,750. Year-over-year, median price per square
foot is down 5.93%, from $2,073 in 2Q23, which corresponded to a 4.51% median sales price increase from $2,300,000.
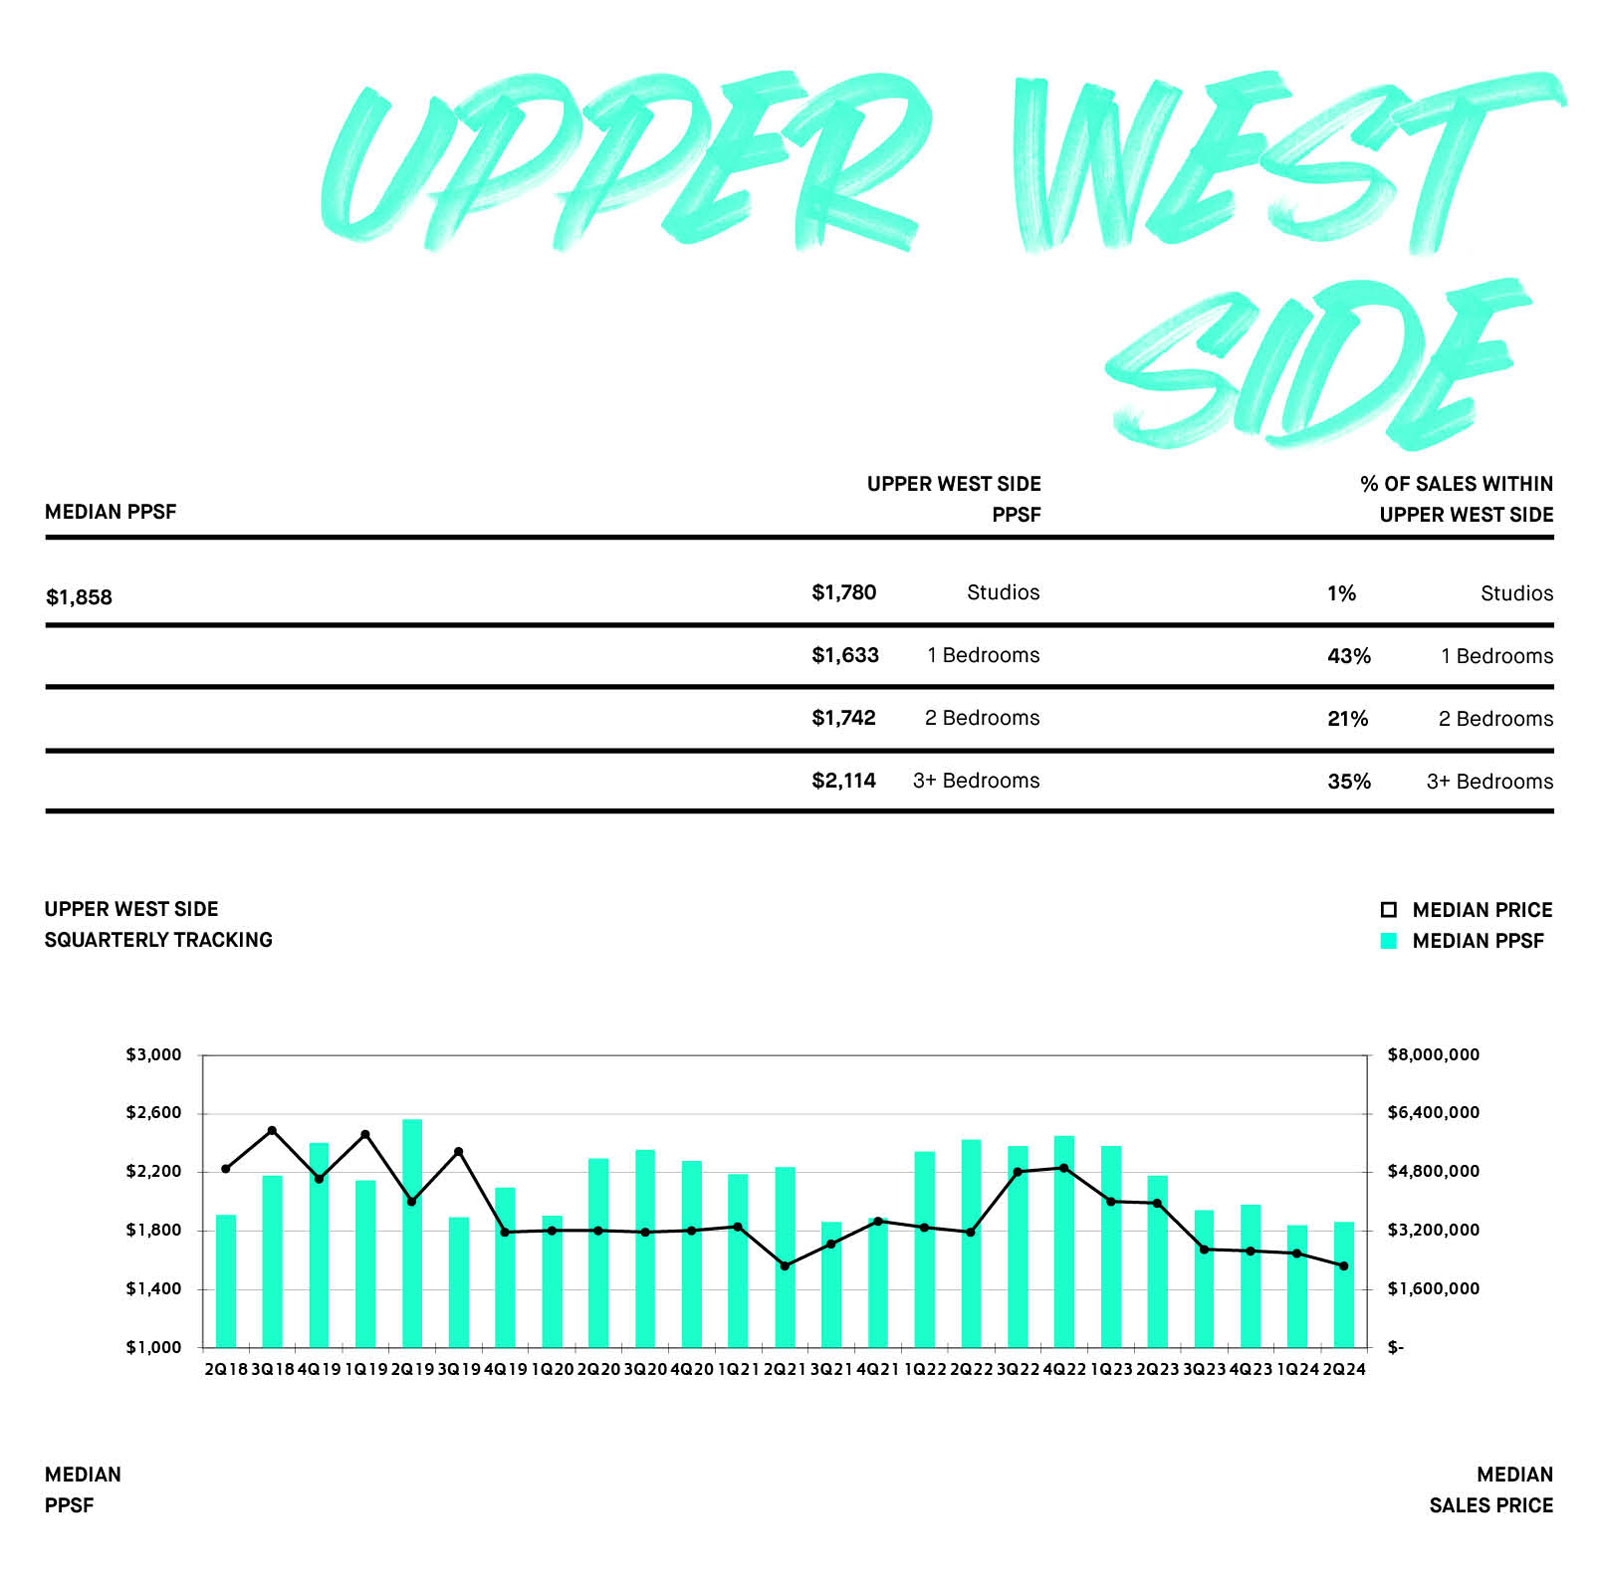
Out of all the neighborhoods tracked by this report, the Upper West Side had the highest number of sponsor sales this past quarter with a recorded 77
closings (21.28%) out of the total 360 closings that occurred in 2Q24.
The highest sales price paid this quarter occurred in Central Park Tower, 217 W 57th St, where the ultra-glamourous duplex penthouse #107 sold for
$117,390,500 (ppsf $9,349). On a price per square foot basis, the highest sale occurred at 220 Central Park South #43B which sold for $10,845psf (px of
$33,000,000).
MARKET UP-SWINGS
The largest quarterly upswing occurred in Greenwich Village / West Village where several apartments in The Keller at 150 Barrow closed, increasing the median price per square foot from $1,894psf to $2,886psf.
MARKET DOWN-SWINGS
The largest quarterly downswing occurred in Harlem which decreased by 22.20%, from $1,254psf to $976psf, driven by a combination of closings in larger 1-br duplex apartments and closings in smaller buildings.
INVENTORY ANALYSIS
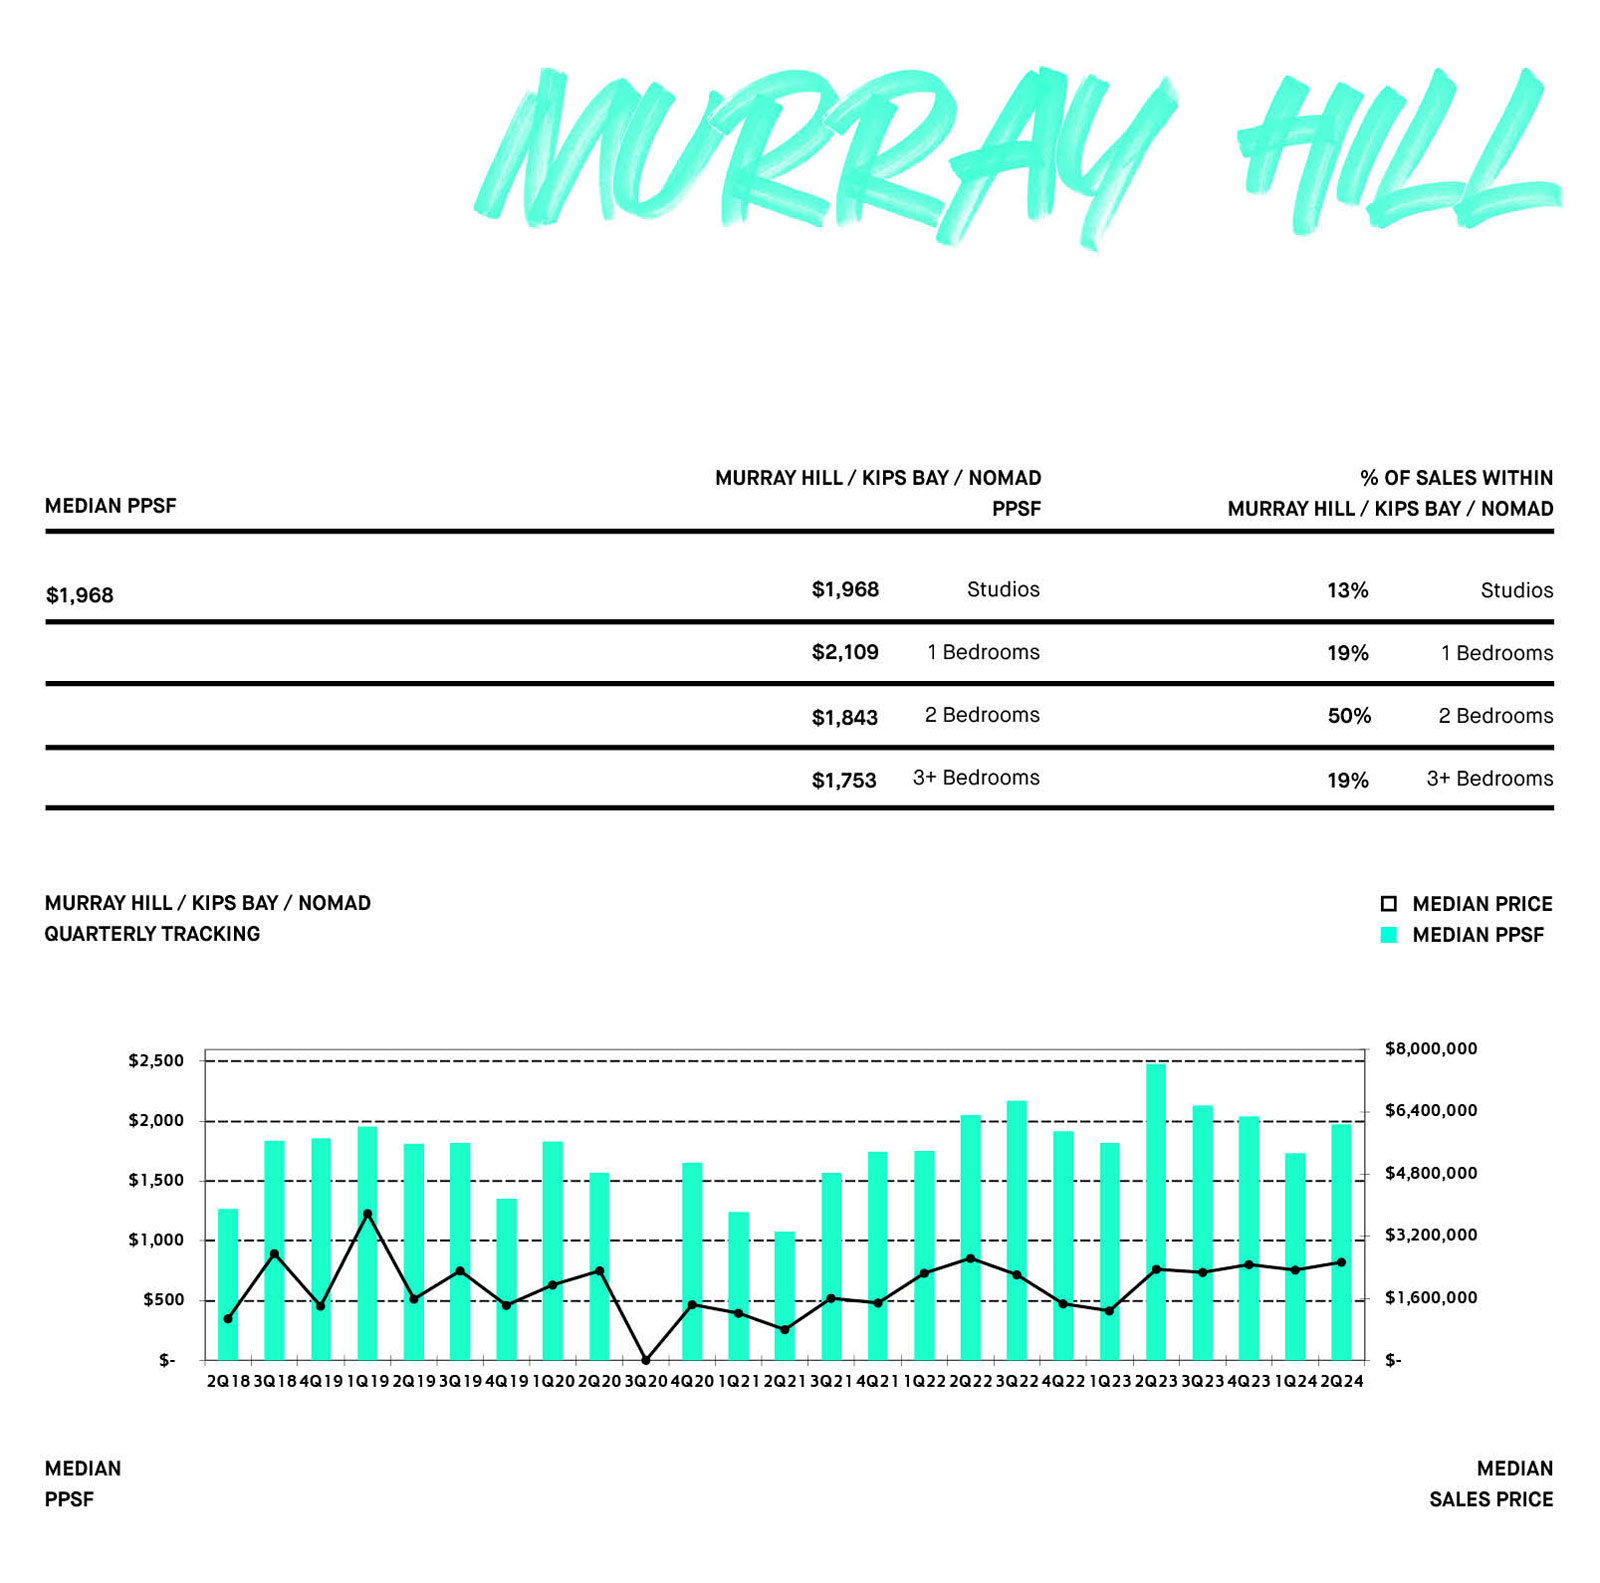
Out of the 360 total sponsor units sold this quarter, 3% or 9 were studios, 33% or 117 were one-bedrooms, 37% or 133 were two-bedrooms, and the remaining 28% or 101 units were three-bedroom units or larger.
NEIGHBORHOODS WHERE THE MAJORITY OF EACH UNIT TYPE WAS SOLD IN 2Q24

44%
STUDIO
UPPER WEST SIDE
28%
ONE-BEDROOM
UPPER WEST SIDE
14%
TWO-BEDROOM
CHELSEA /
HUDSON YARDS
27%
THREE-BEDROOMS+
UPPER WEST SIDE
MARKET SNAPSHOT

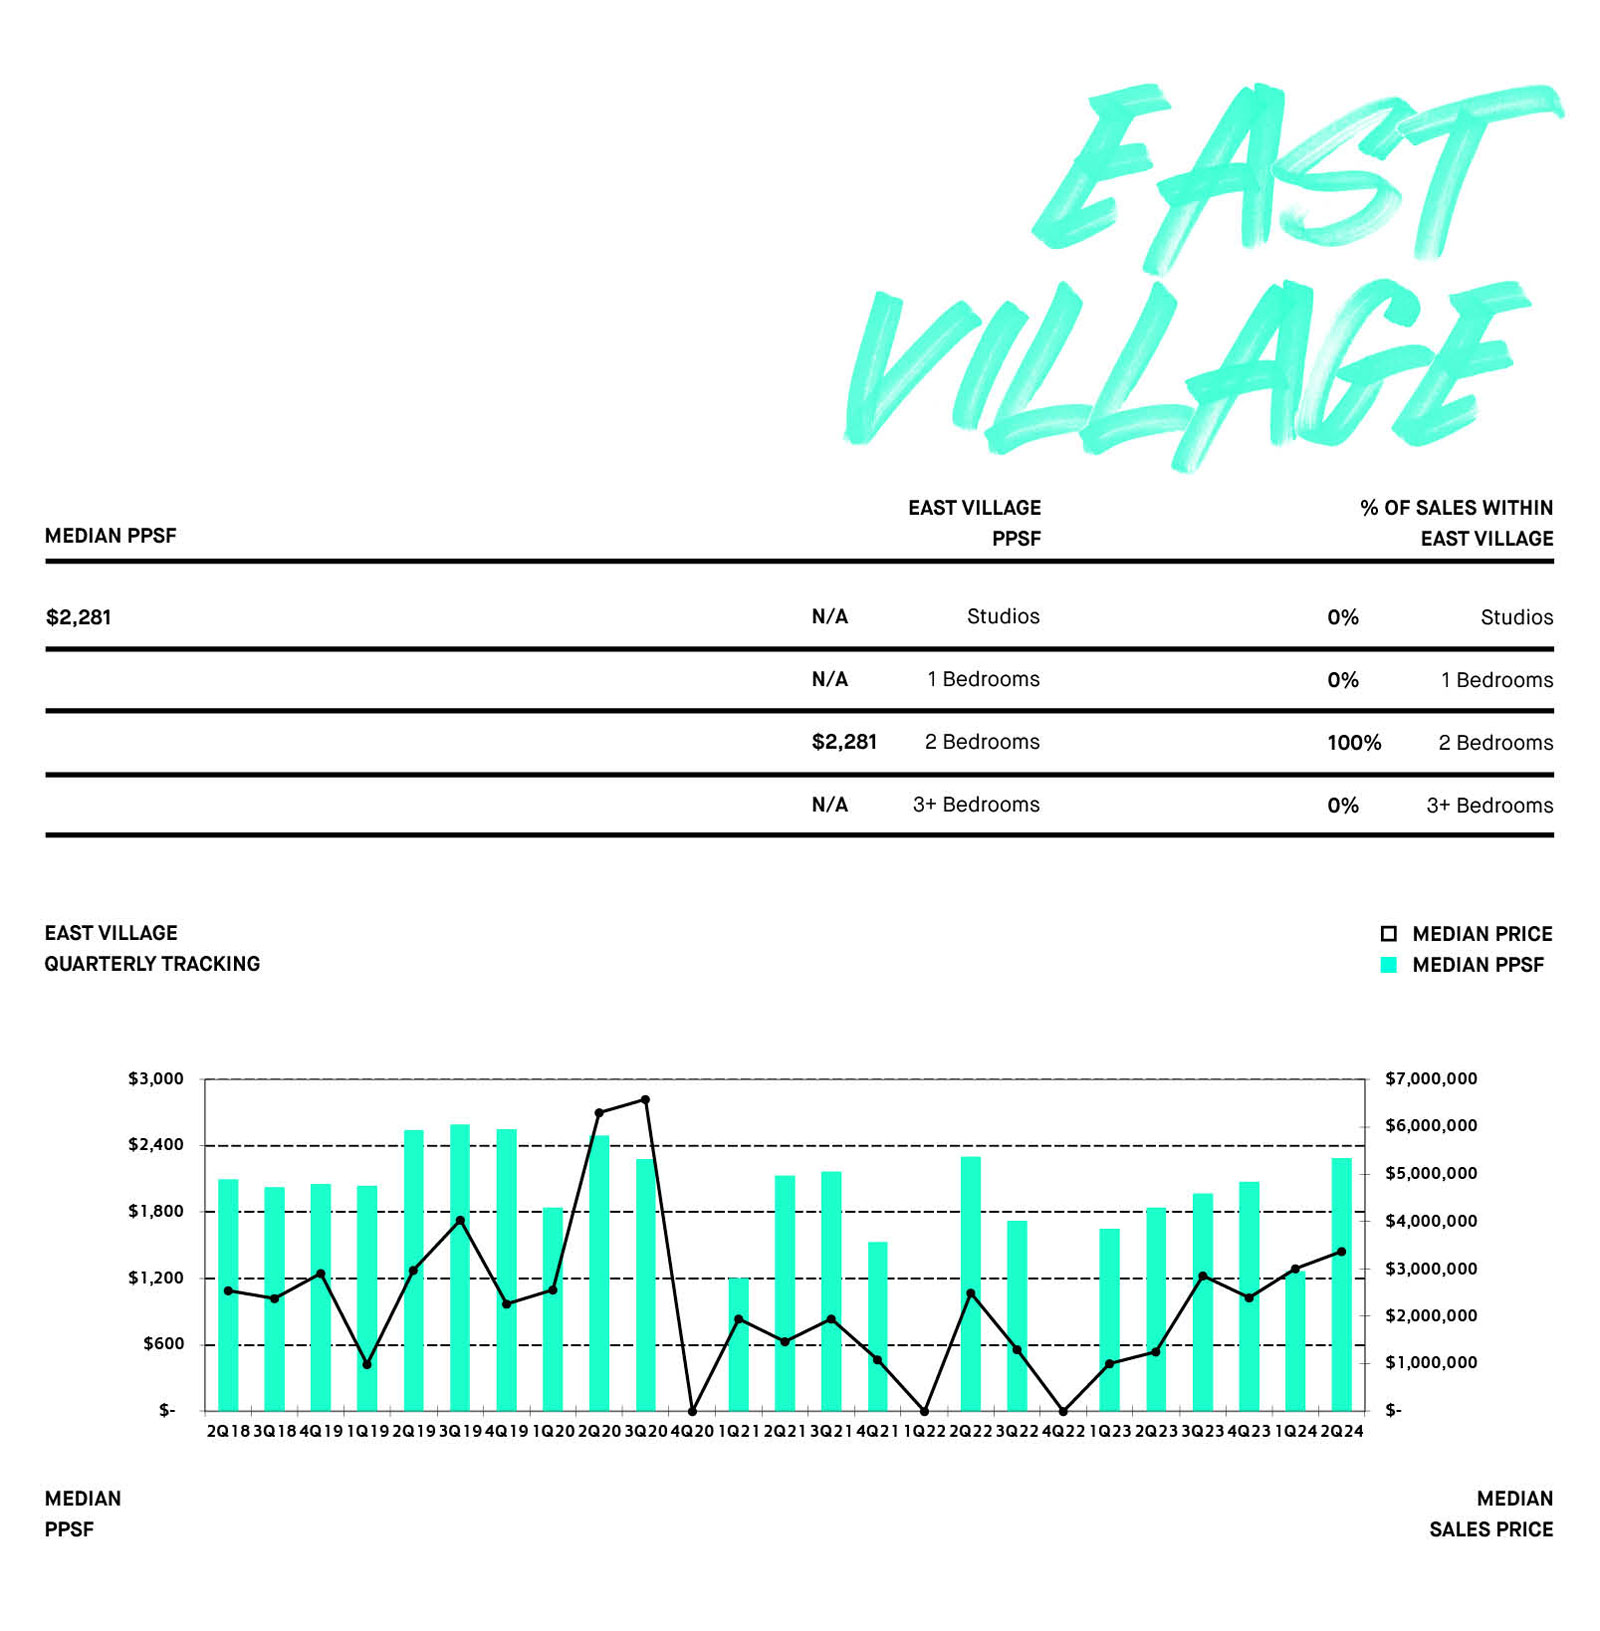
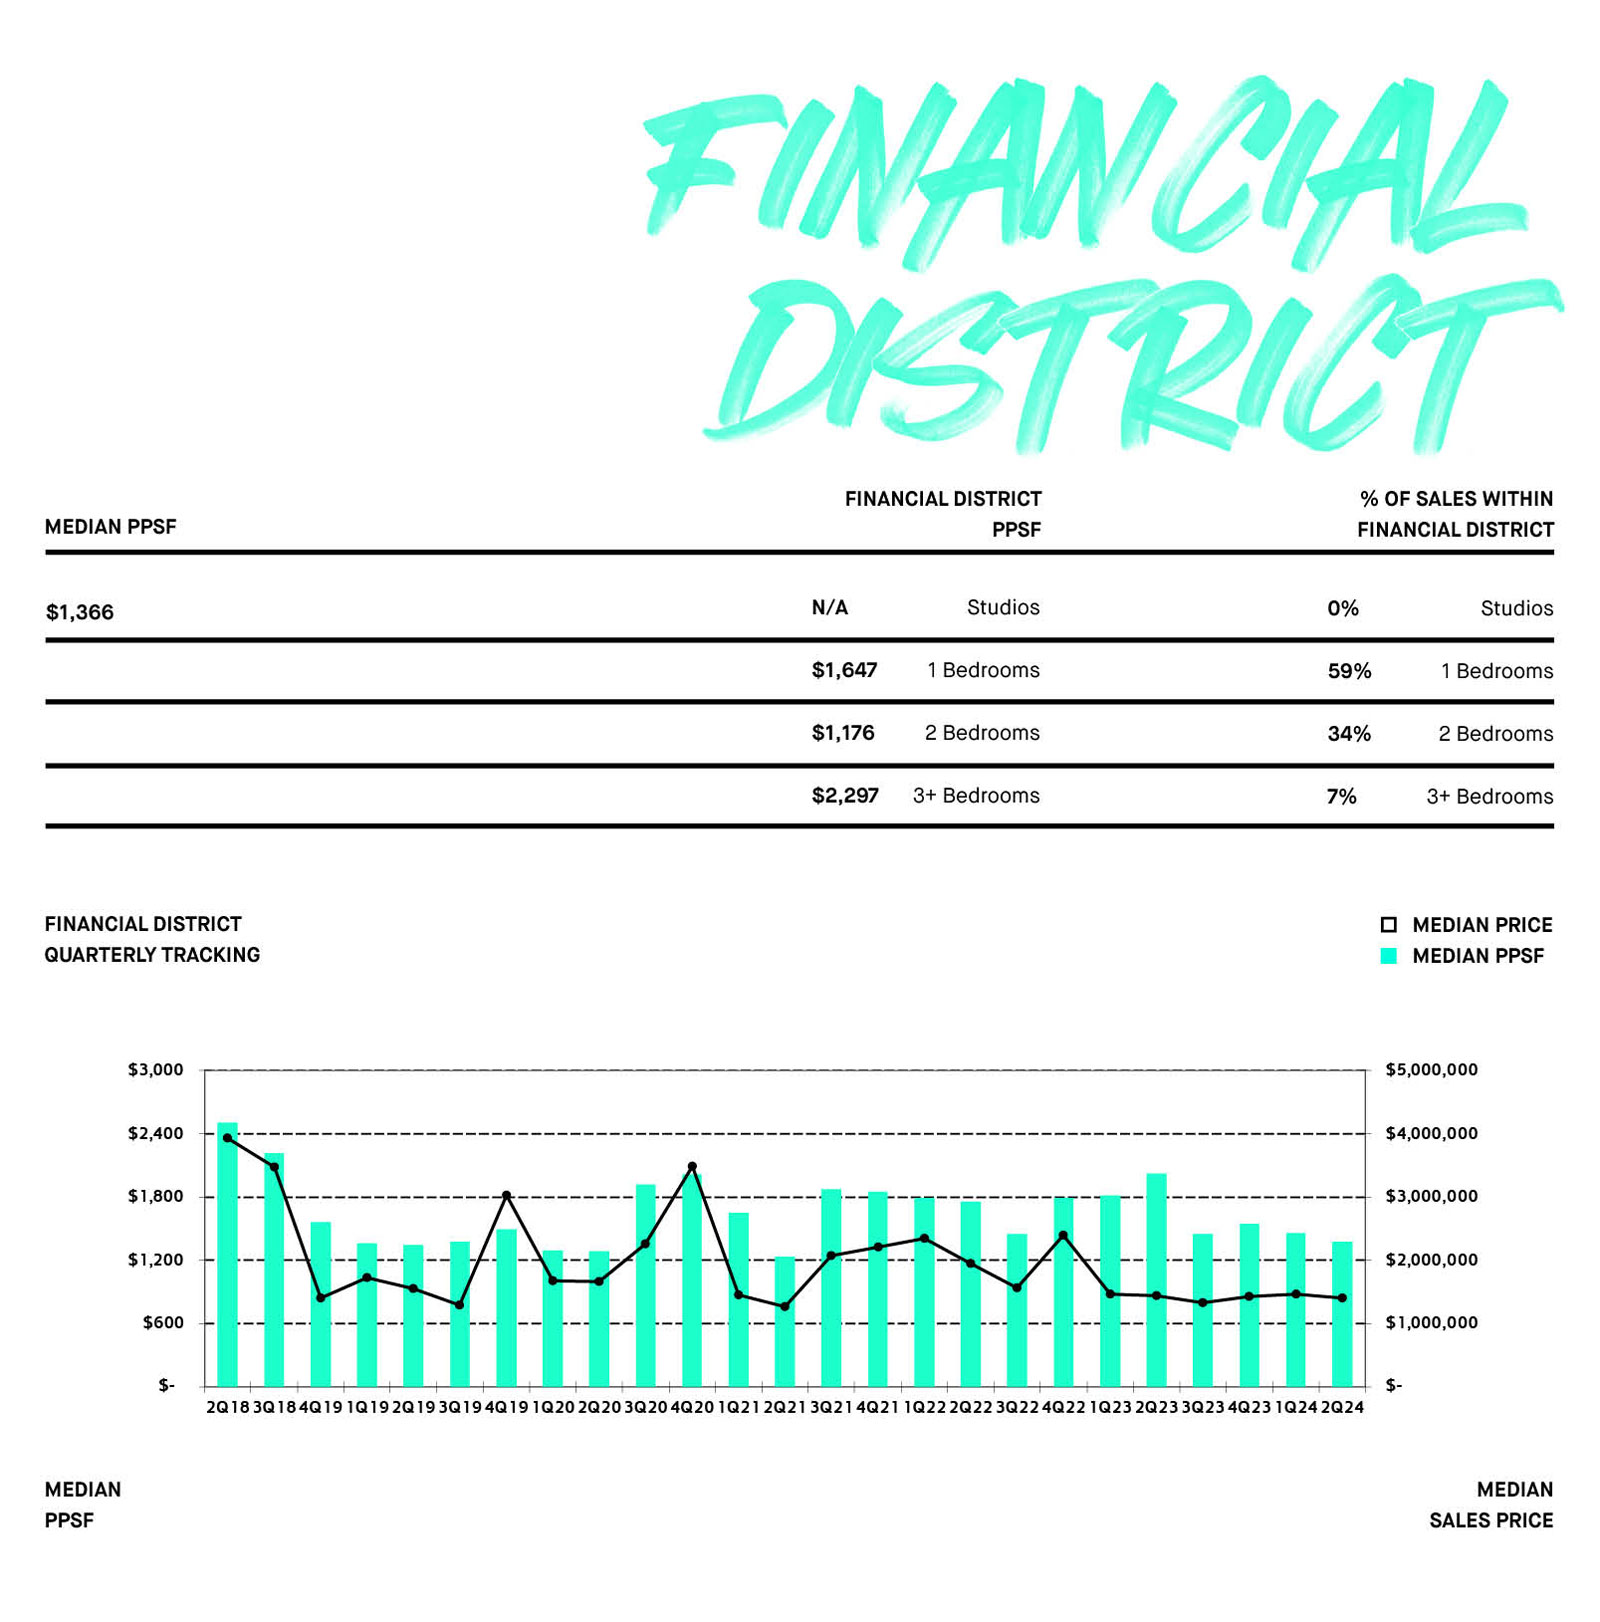
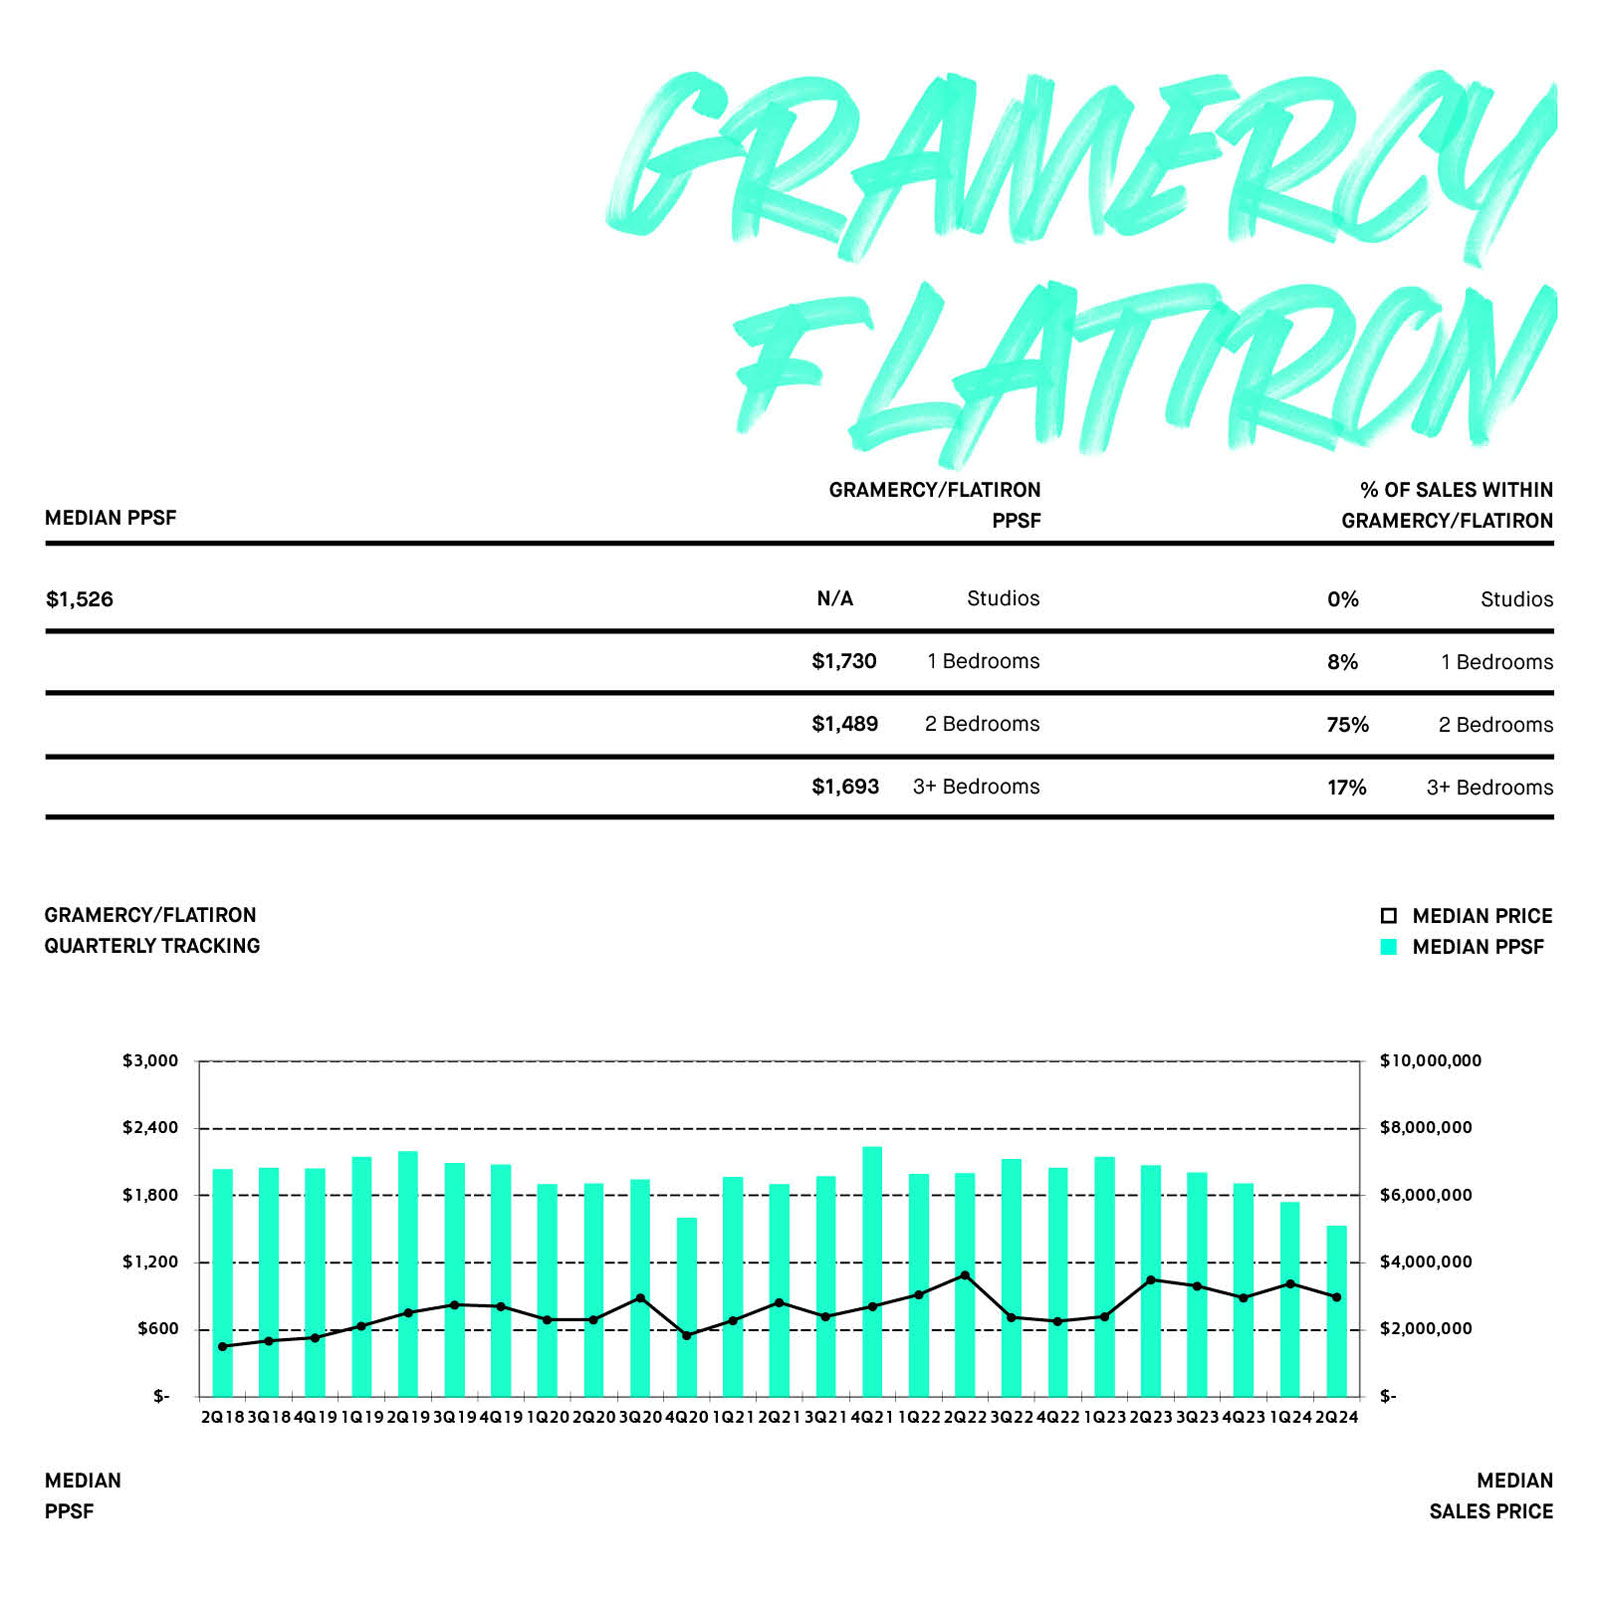
2Q24 MEDIAN PRICE PER SQUARE FOOT (PPSF) BY NEIGHBORHOOD

2Q24 MEDIAN SALES PRICE BY NEIGHBORHOOD

2Q24 % OF TOTAL SPONSOR SALES BOROUGH-WIDE

NUMBER OF UNITS SOLD IN 2Q24
THE REPORT EXPLAINED
INCLUDED IN THIS RESEARCH ARE WALK-UP AND ELEVATOR NEW DEVELOPMENT CONDOMINIUM BUILDINGS, AS WELL AS NEW CONVERSION CONDOMINIUMS IF THE SALES WERE APPLICABLE SPONSOR TRANSACTIONS. EXCLUDED FROM THE REPORT ARE ALL COOPERATIVE SALES.
Unit types such as studios, one-bedrooms, and two-bedroom units are grouped by square footage ranges. Typically, studios are under 550 square feet, one-bedrooms range from 500-750 square feet, two-bedrooms from 800-1,000 square feet and three-bedrooms+ from 950 square feet to in excess of 1,500 square feet. Presented with a quarter-over quarter and year-over-year comparison, both city-wide and by neighborhood, MNS New Development ReportTM tracks the market trends throughout Manhattan and Brooklyn. MNS offers a unique insight into the new development market by tracking stalled construction sites on a quarterly basis, a great indicator of where development in general is moving. MNS is your source to find neighborhood price per square foot analysis, average sale prices, unit type sales trends, overall price movement, neighborhood inventory comparisons, and absorption rates.
Can’t find what you’re looking for? Ask MNS for more information at www.mns.com
Contact Us Now: 718.222.0211
Note: All market data is collected and compiled by MNS’ marketing department. The information presented here is intended for instructive purposes only and has been gathered from sources deemed reliable, though it may be subject to errors, omissions, changes or withdrawal without notice.
If you would like to republish this report on the web, please be sure to source it as the “Manhattan New Development Report” with a link back to its original location