BROOKLYN RENTAL MARKET REPORT

BROOKLYN RENTAL MARKET REPORT ARCHIVE
sign up for rental Market reports to be sent to your email
TABLE OF CONTENTS
JUMP TO A PARTICULAR SECTION
introduction
THE AVERAGE RENT IN BROOKLYN HAS INCREASED THIS MONTH.
-
CHANGE
-
$3,981APRIL 2026
-
$4,039MAY 2026
A QUICK LOOK

Over the past month, the average rental price in Brooklyn has increased by 1.45%, from $3,981 to $4,039. The average rental price for a studio unit increased by 1.52%, from $3,083 to $3,130. The average rental price for a one-bedroom unit increased by 0.37%, from $3,890 to $3,904. The average rental price for a two-bedroom unit increased by 2.25%, from $4,971 to $5,083.
This past month, the most expensive studio, one and two-bedroom units by average price were all seen in Dumbo; while the most affordable studio and one-bedroom units were in Bay Ridge. The most affordable two-bedroom units were in Borough Park / Sunset Park.
Out of the sixteen neighborhoods tracked by this report, fifteen saw their average rental prices increase month-over-month. The remaining areas decreased this month.
- Bay Ridge: +0.57%
- Bed Stuy: +0.87%
- Boerum Hill: +3.50%
- Borough Park/Sunset Park: +1.37%
- Brooklyn Heights: +0.51%
- Bushwick: +3.57%
- Clinton Hill: +2.49%
- Cobble Hill: +5.30%
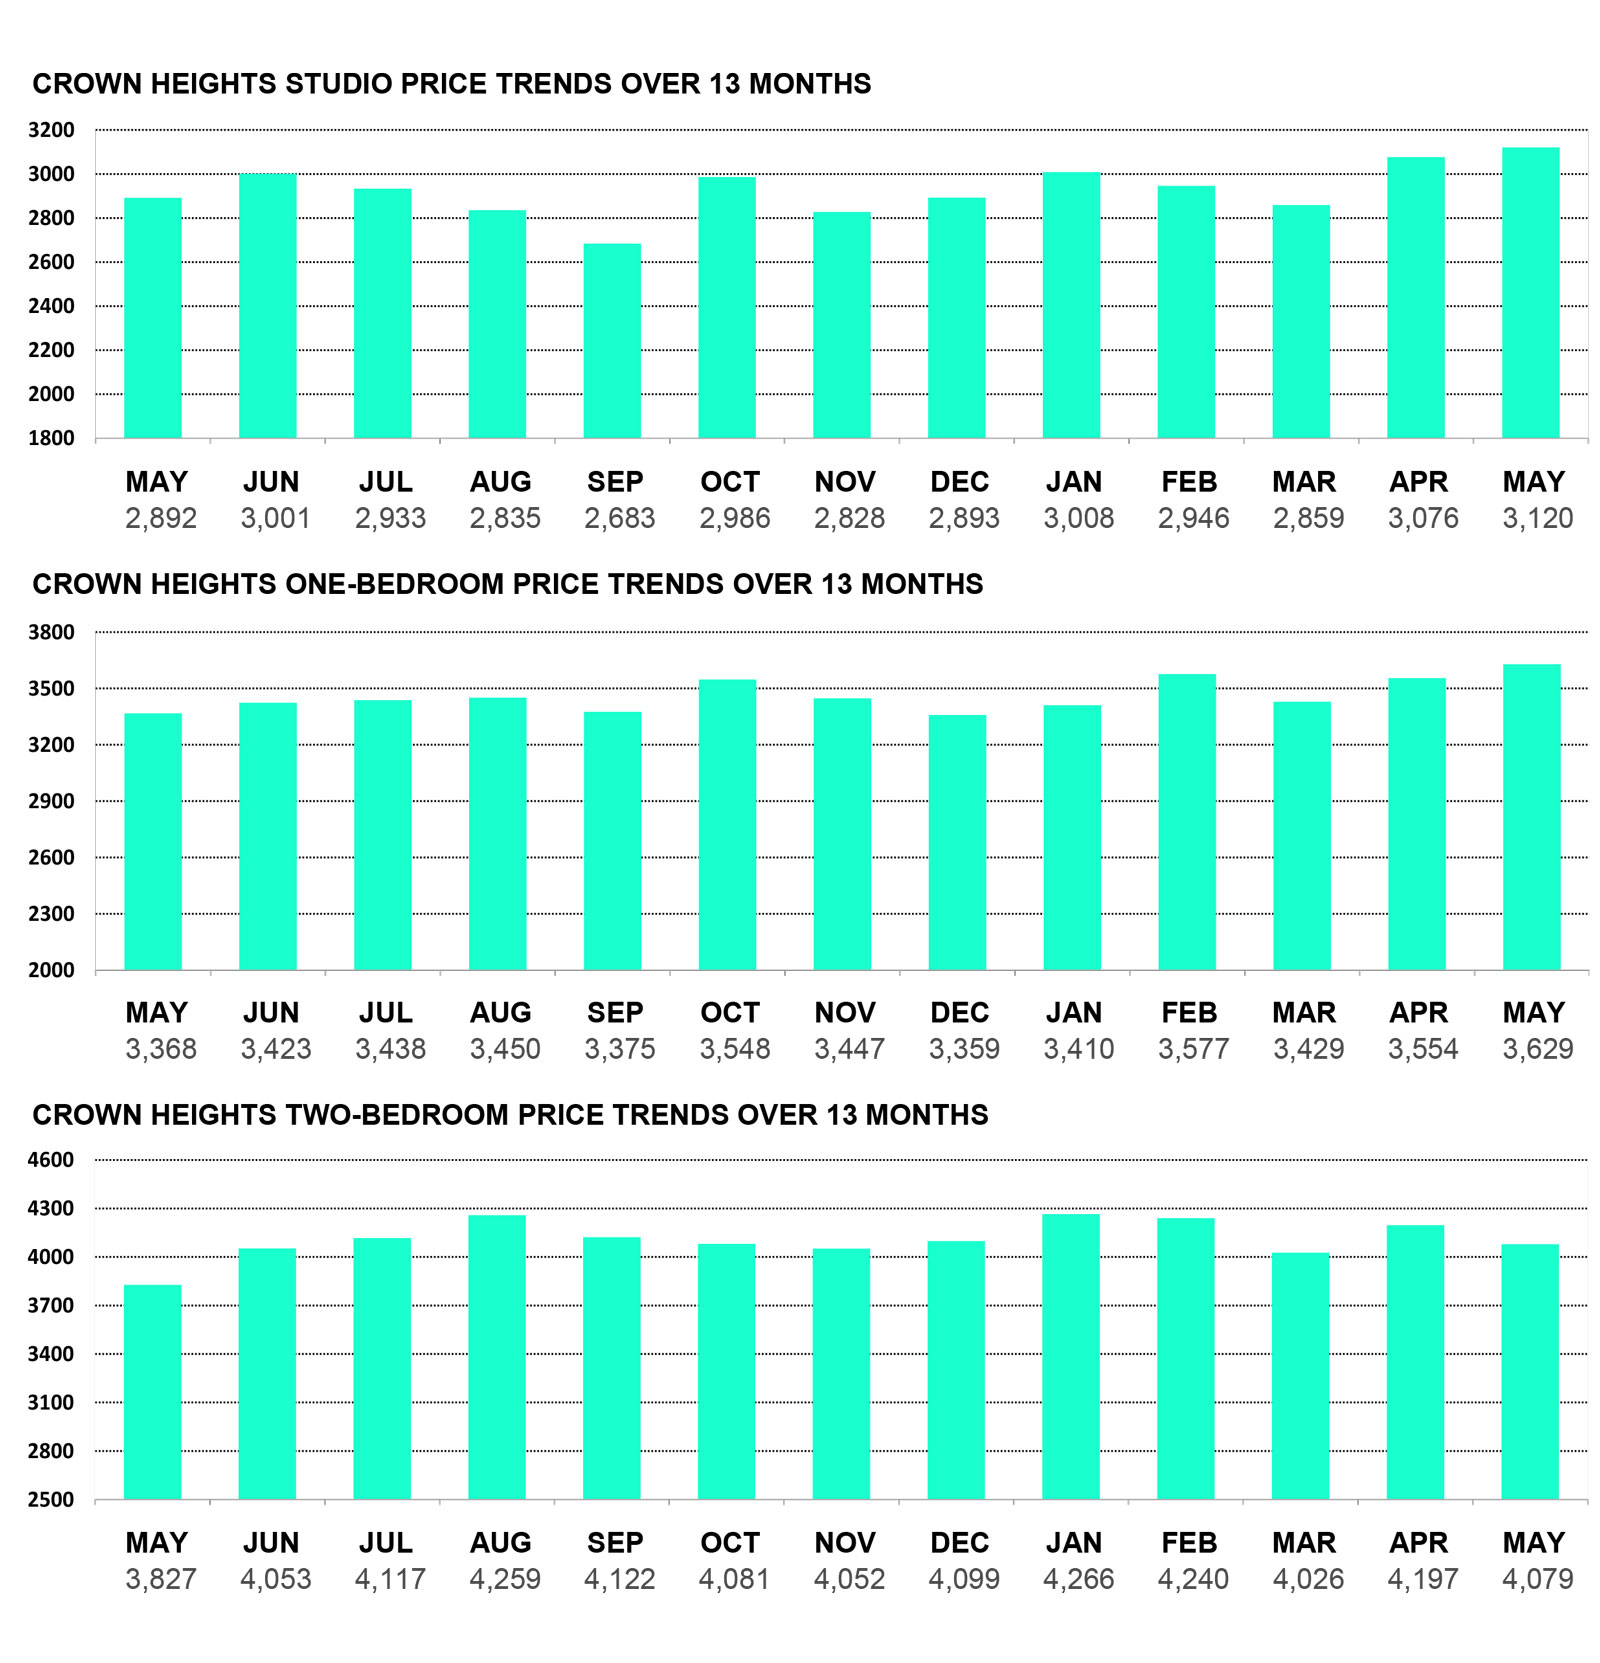
- Crown Heights: +0.01%
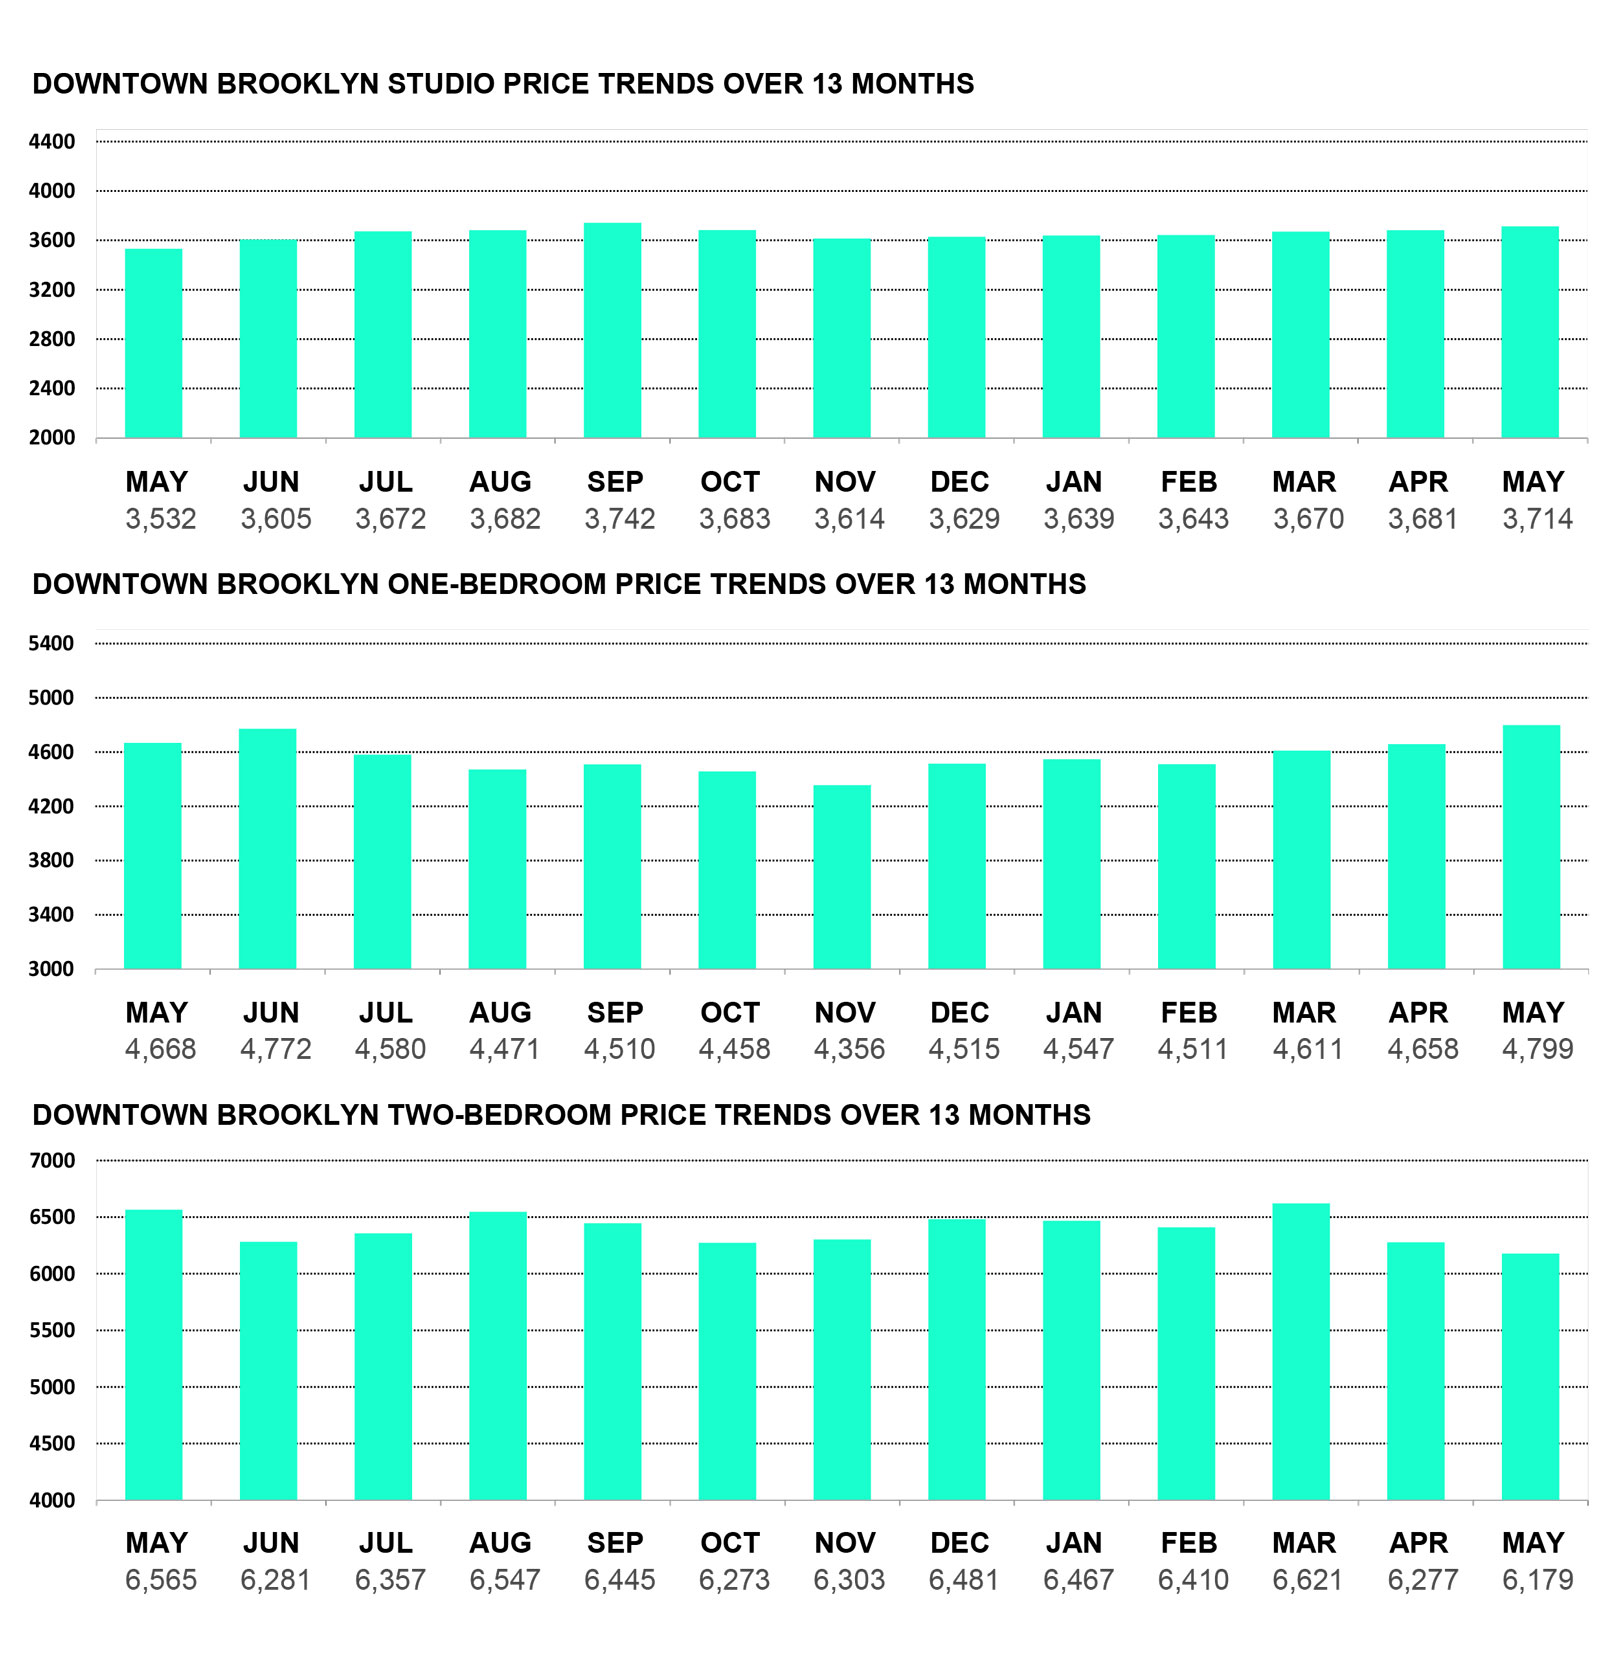
- Downtown Brooklyn: +0.51%
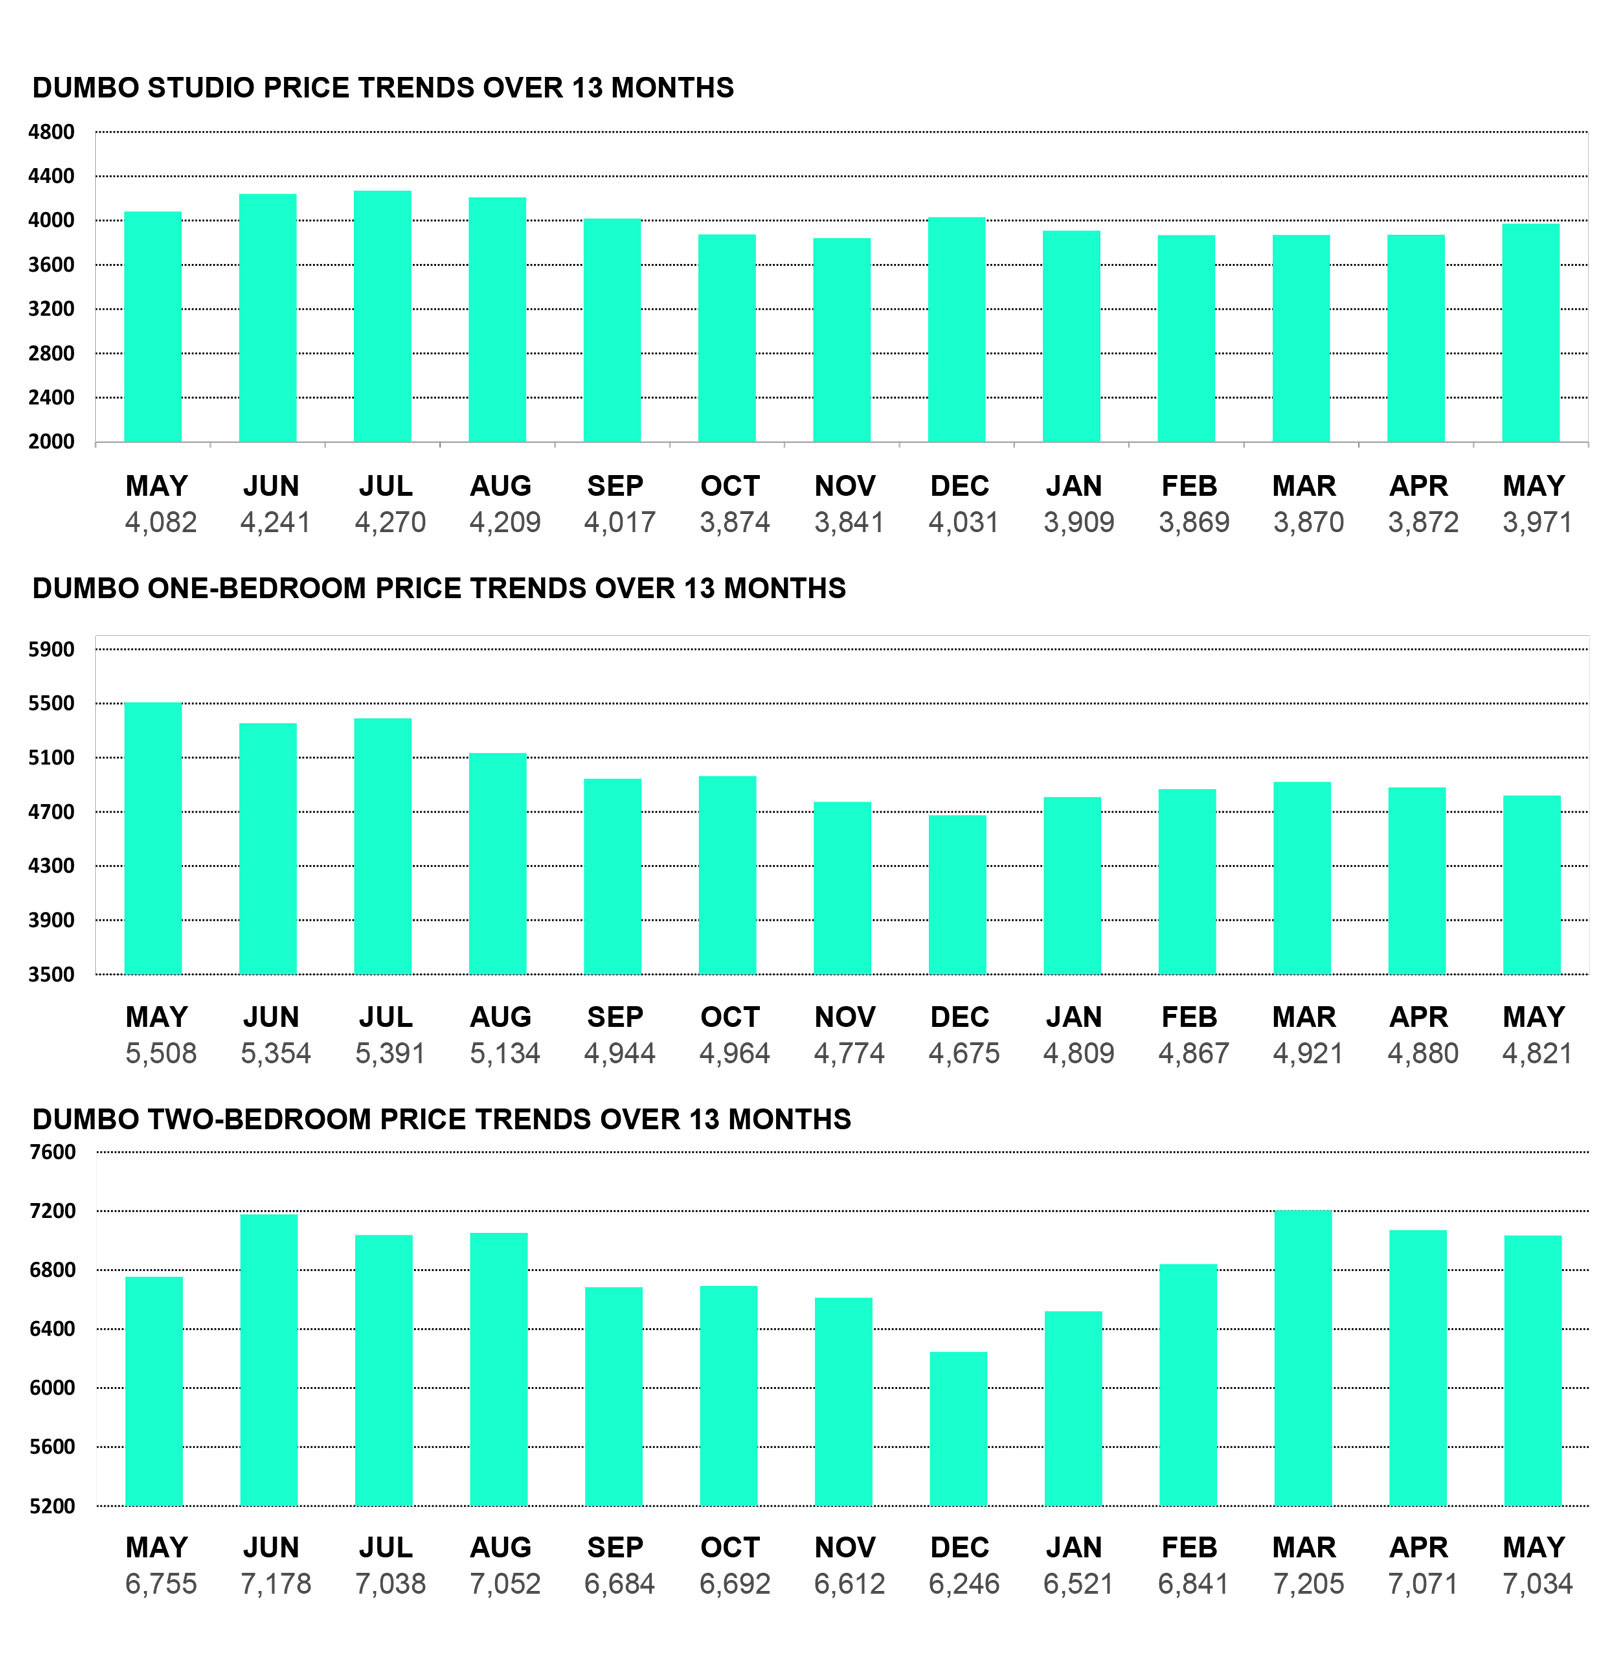
- Dumbo: +0.02%
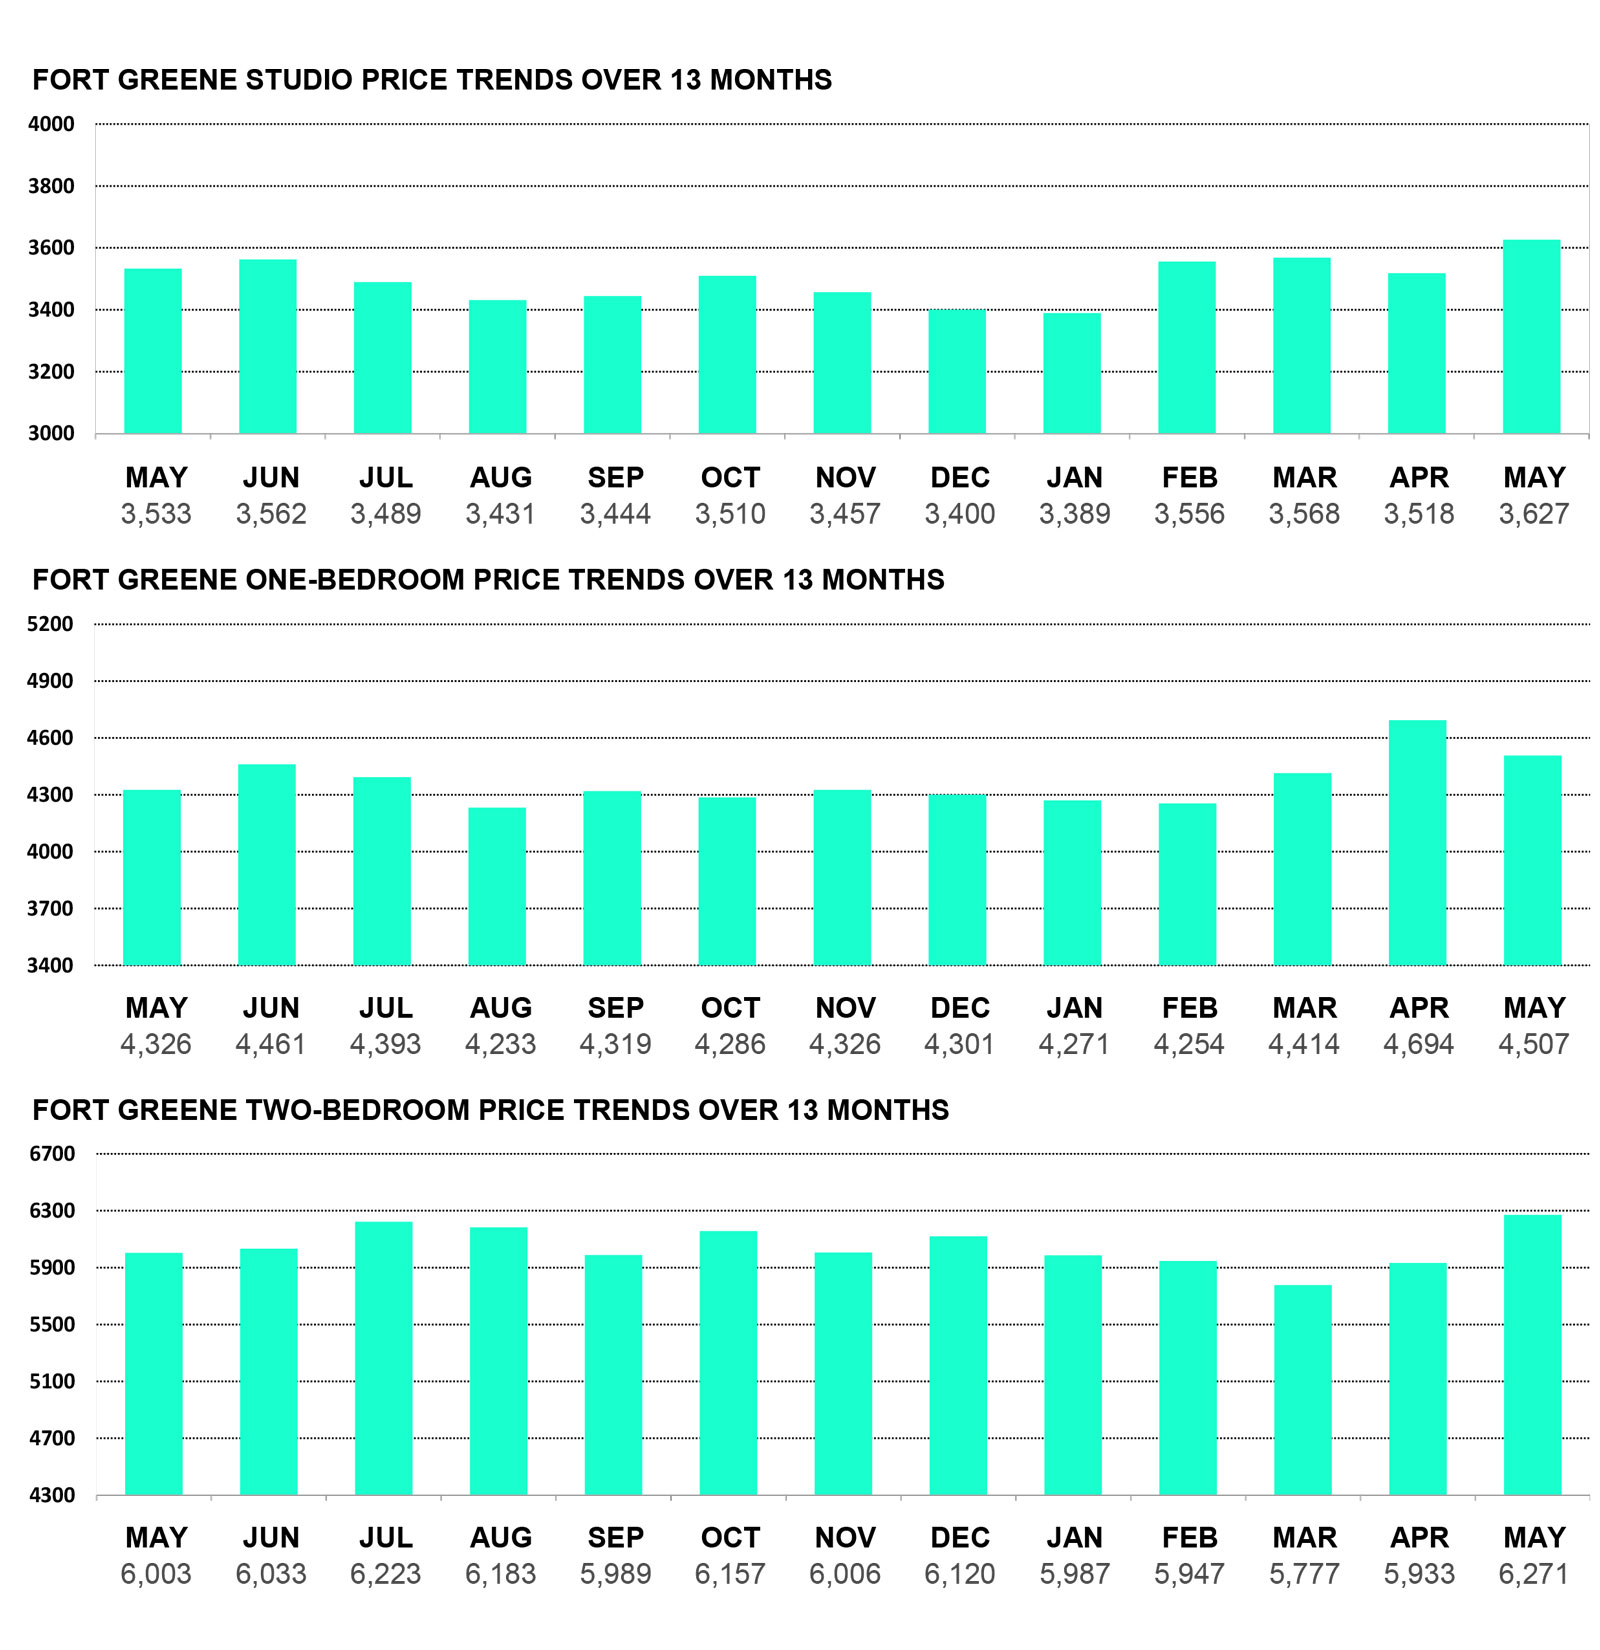
- Fort Greene: +1.84%
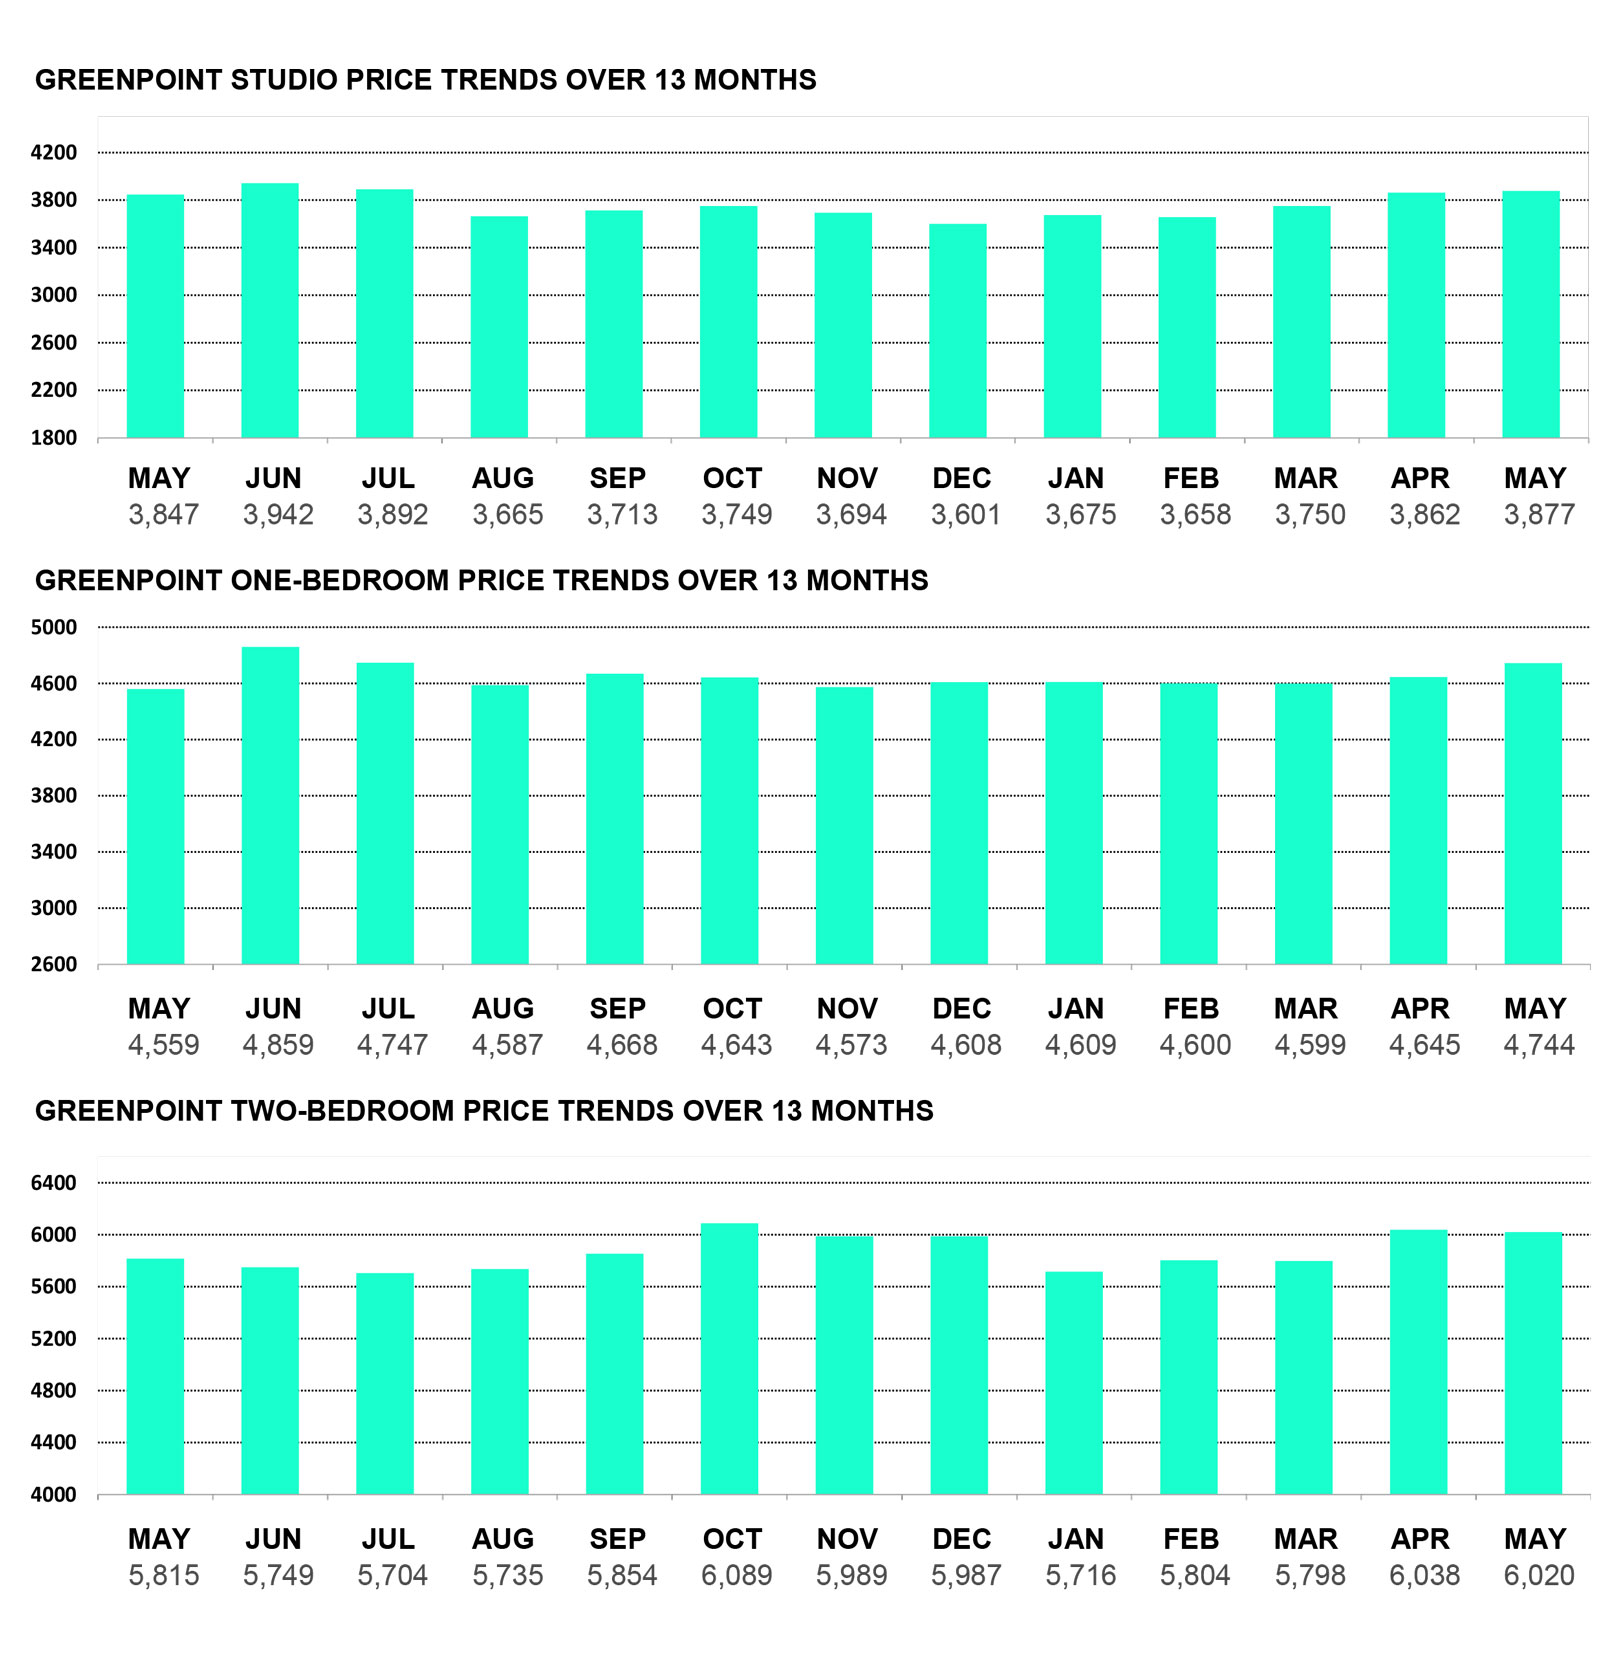
- Greenpoint: +0.66%
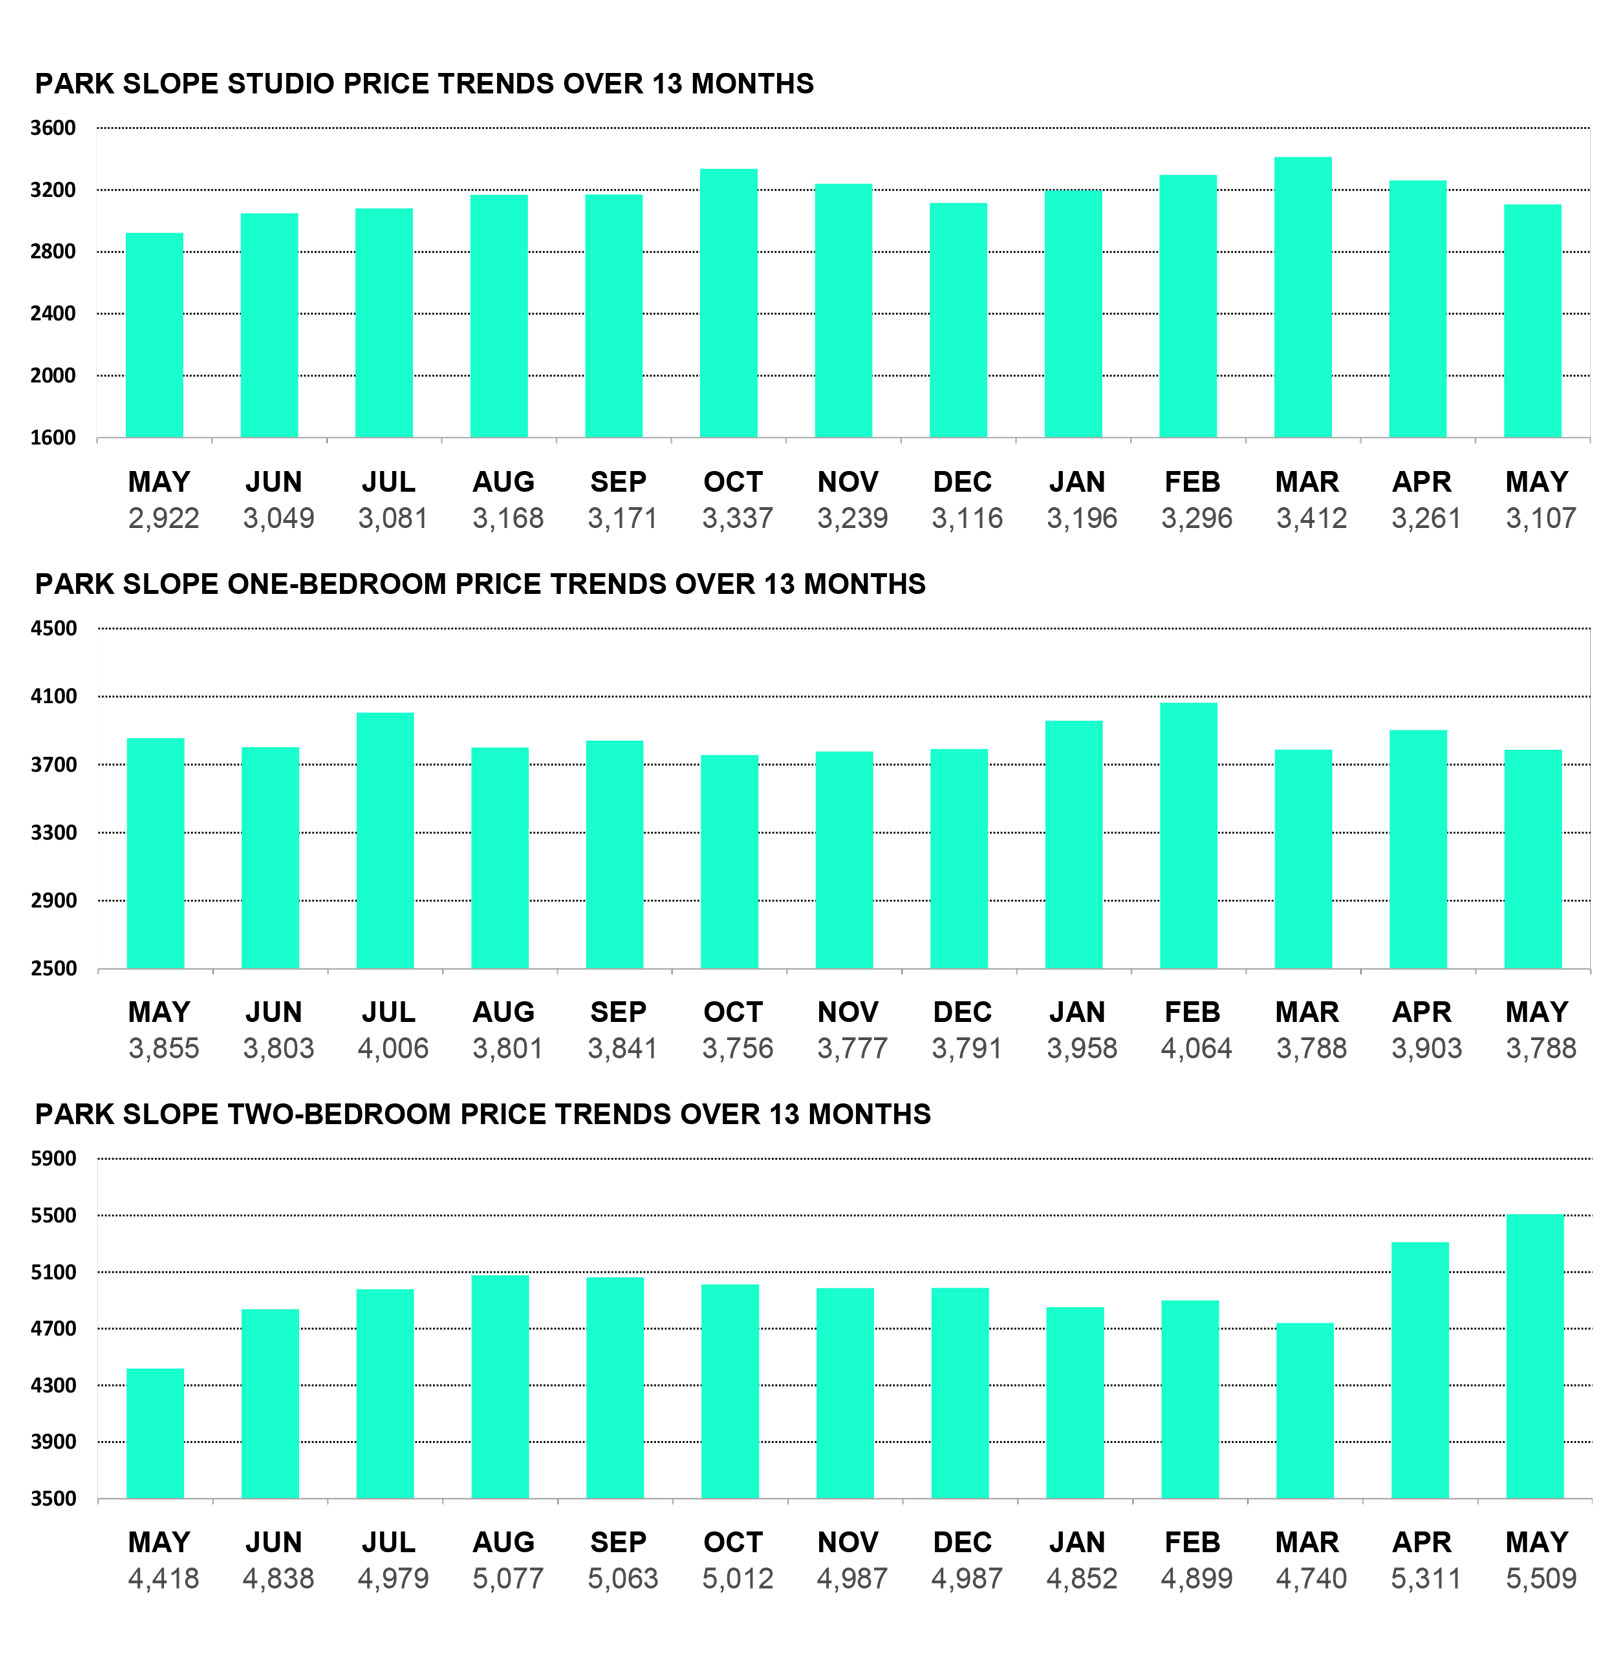
- Park Slope: -0.58%
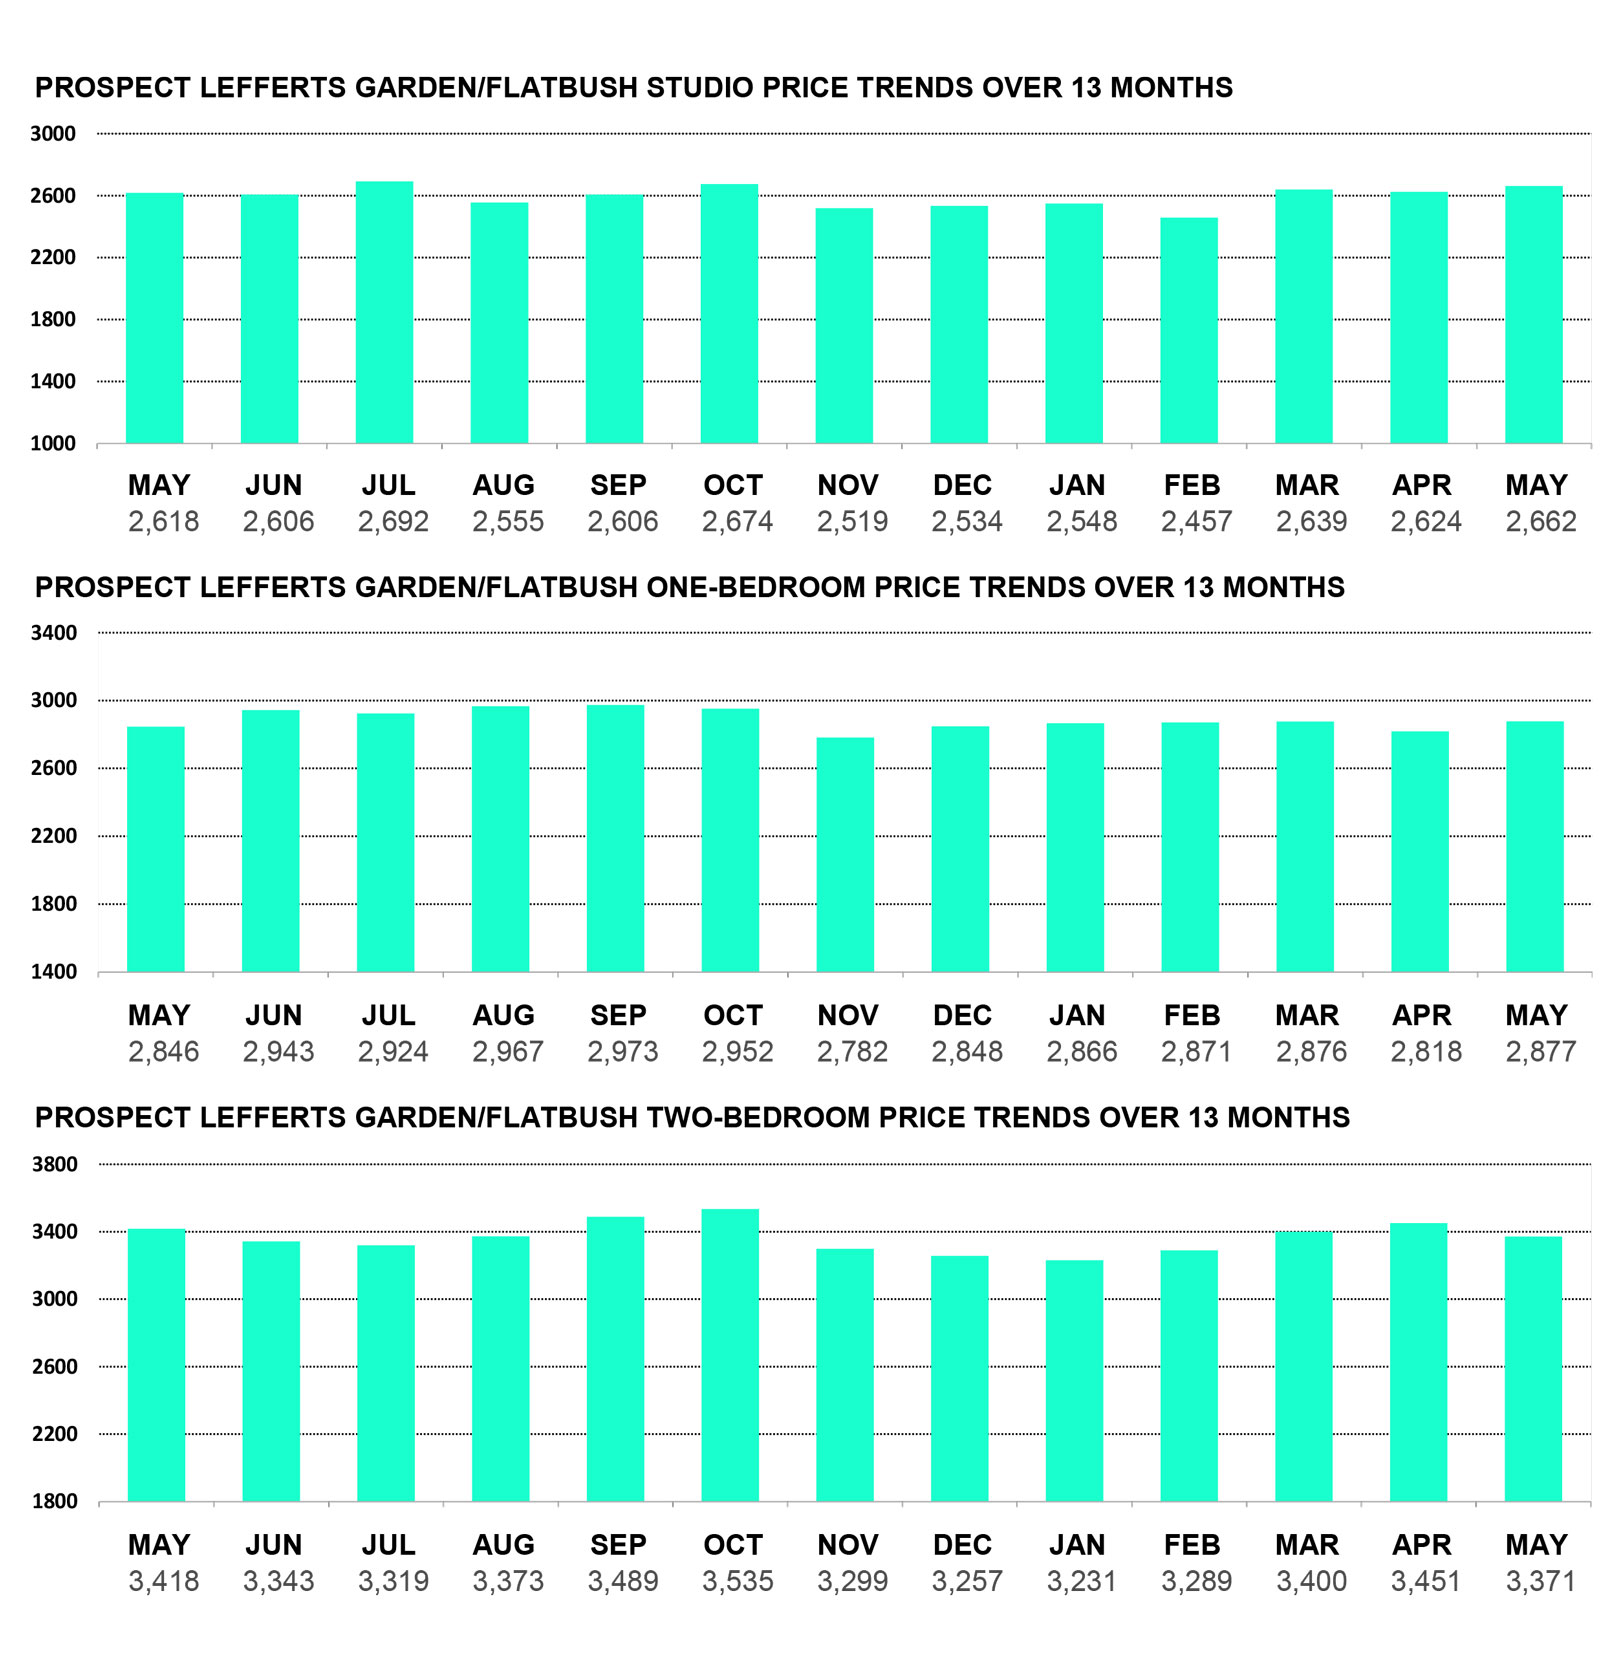
- PLG/Flatbush: +0.19%
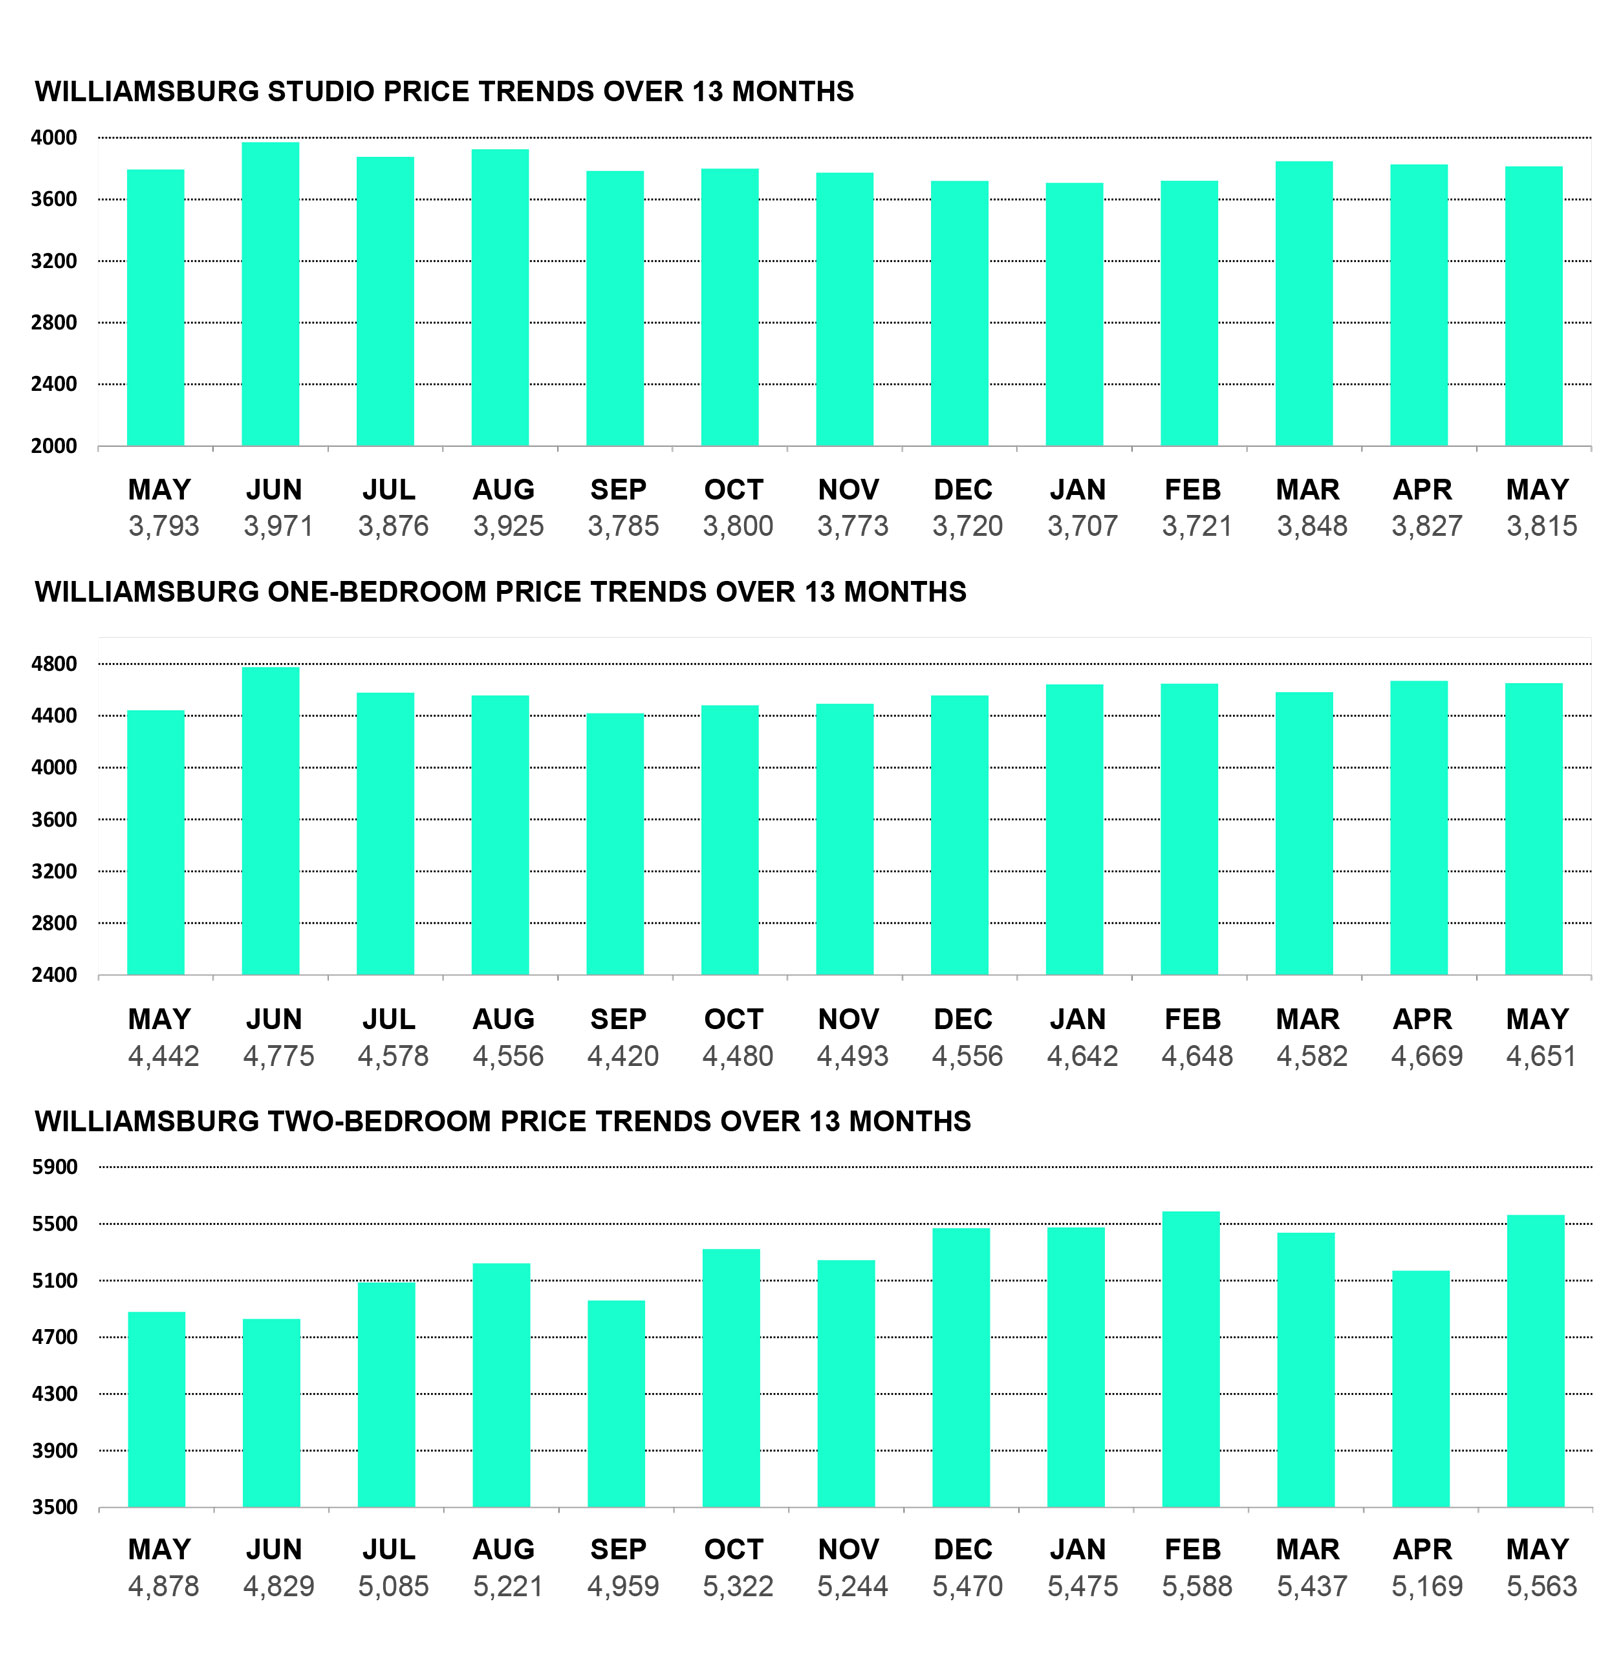
- Williamsburg: +2.66%
Compared to this time last year, rental prices are up across-the-board with studio, one-bedroom and two-bedroom unit prices by 1.76%, 4.16%, and 6.45%, respectively. Overall, average rental pricing in Brooklyn has increased by 4.47% since last year.
NOTABLE TRENDS
| TYPE | MOST EXPENSIVE | LEAST EXPENSIVE |
|---|---|---|
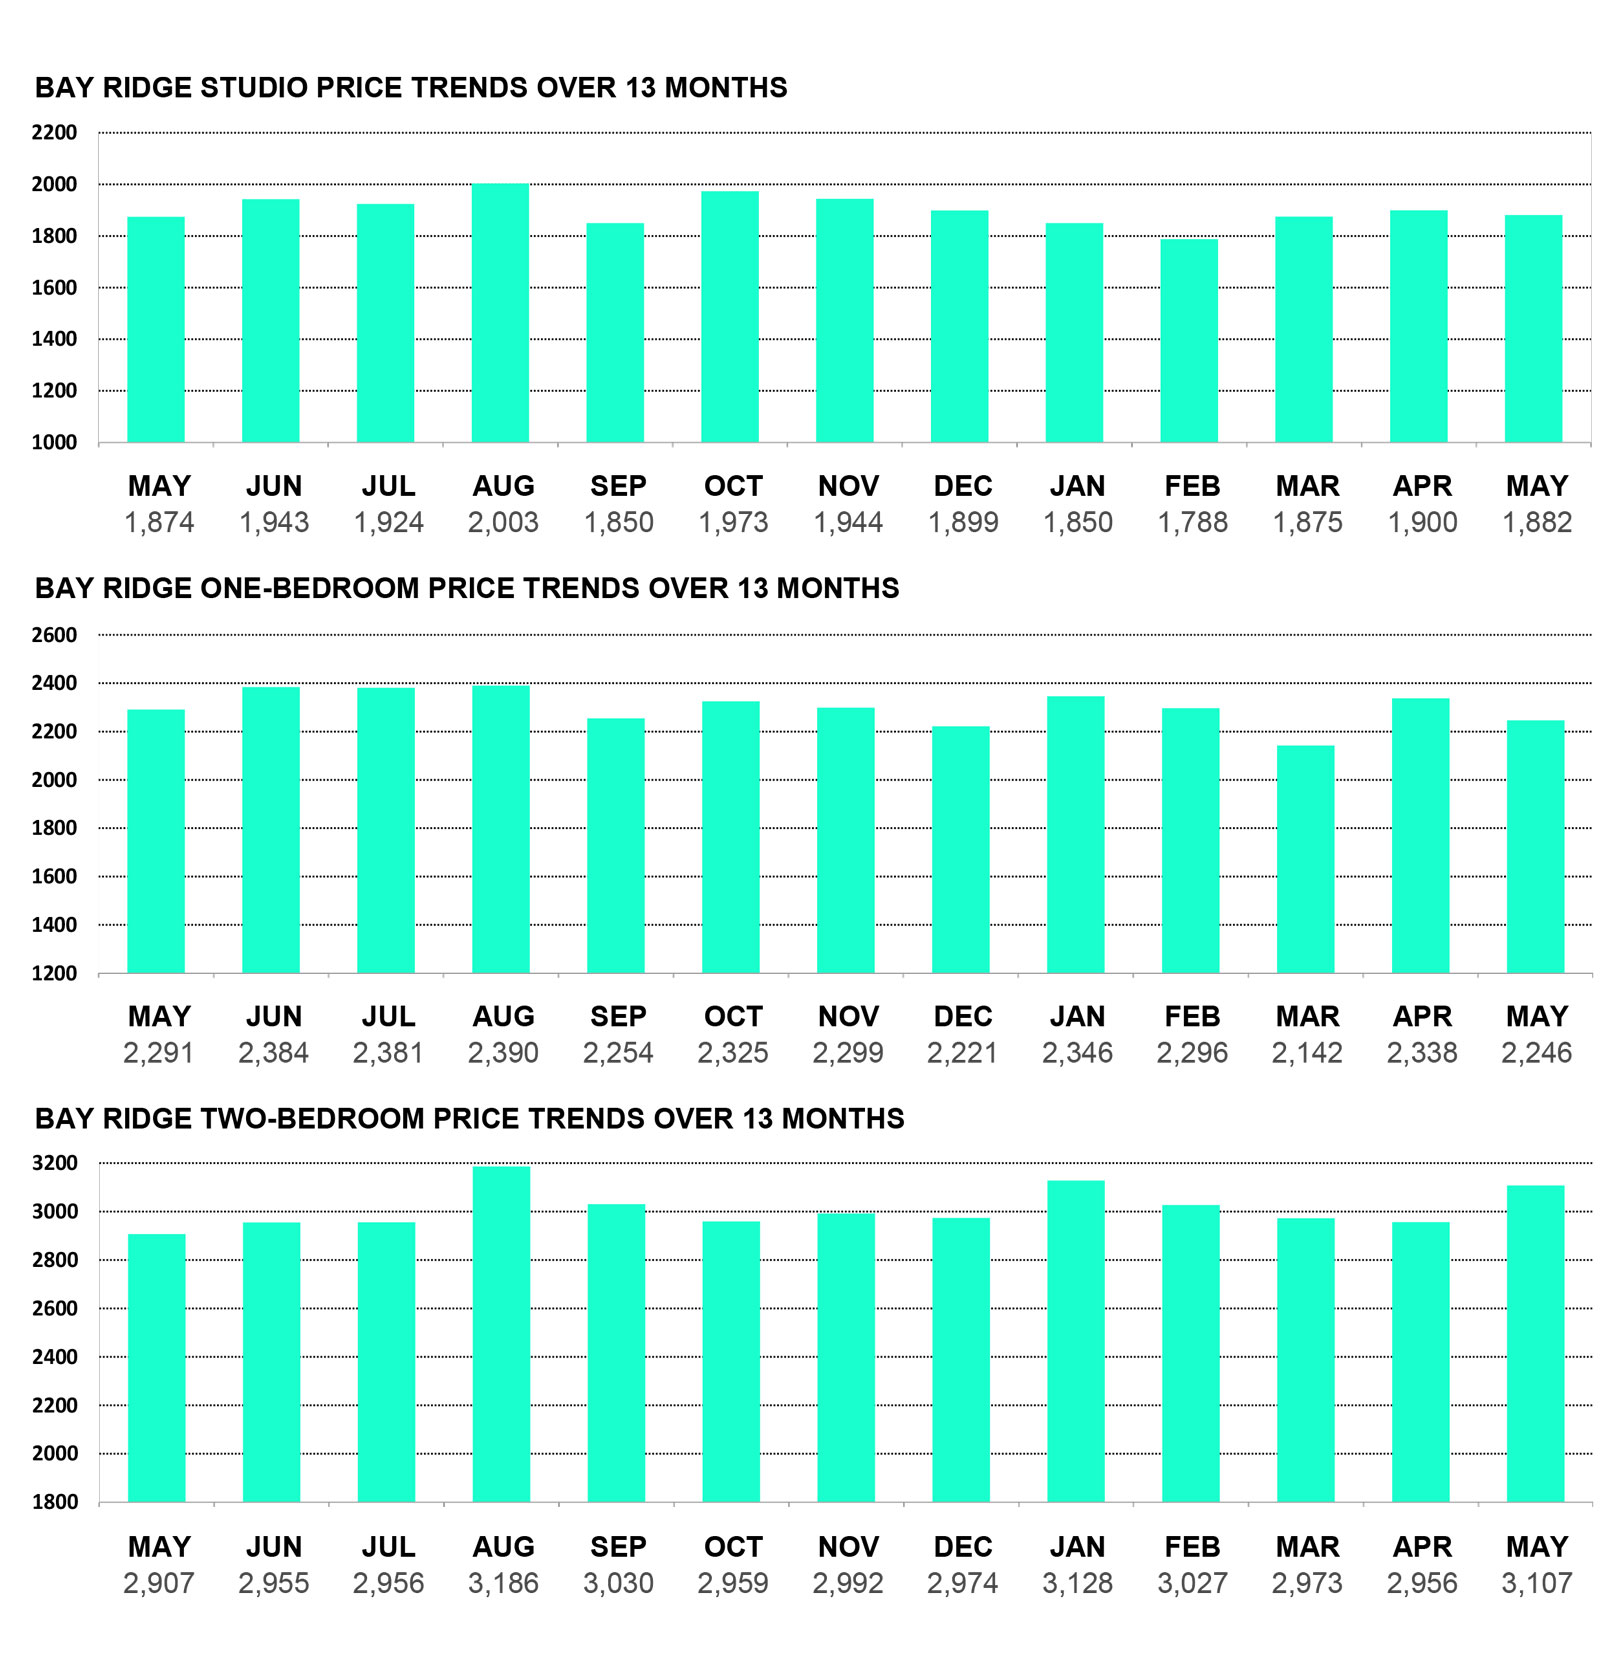
| Studios | Dumbo $3,971 | Bay Ridge $1,882 |
| One bedrooms | Dumbo $4,821 | Bay Ridge $2,246 |
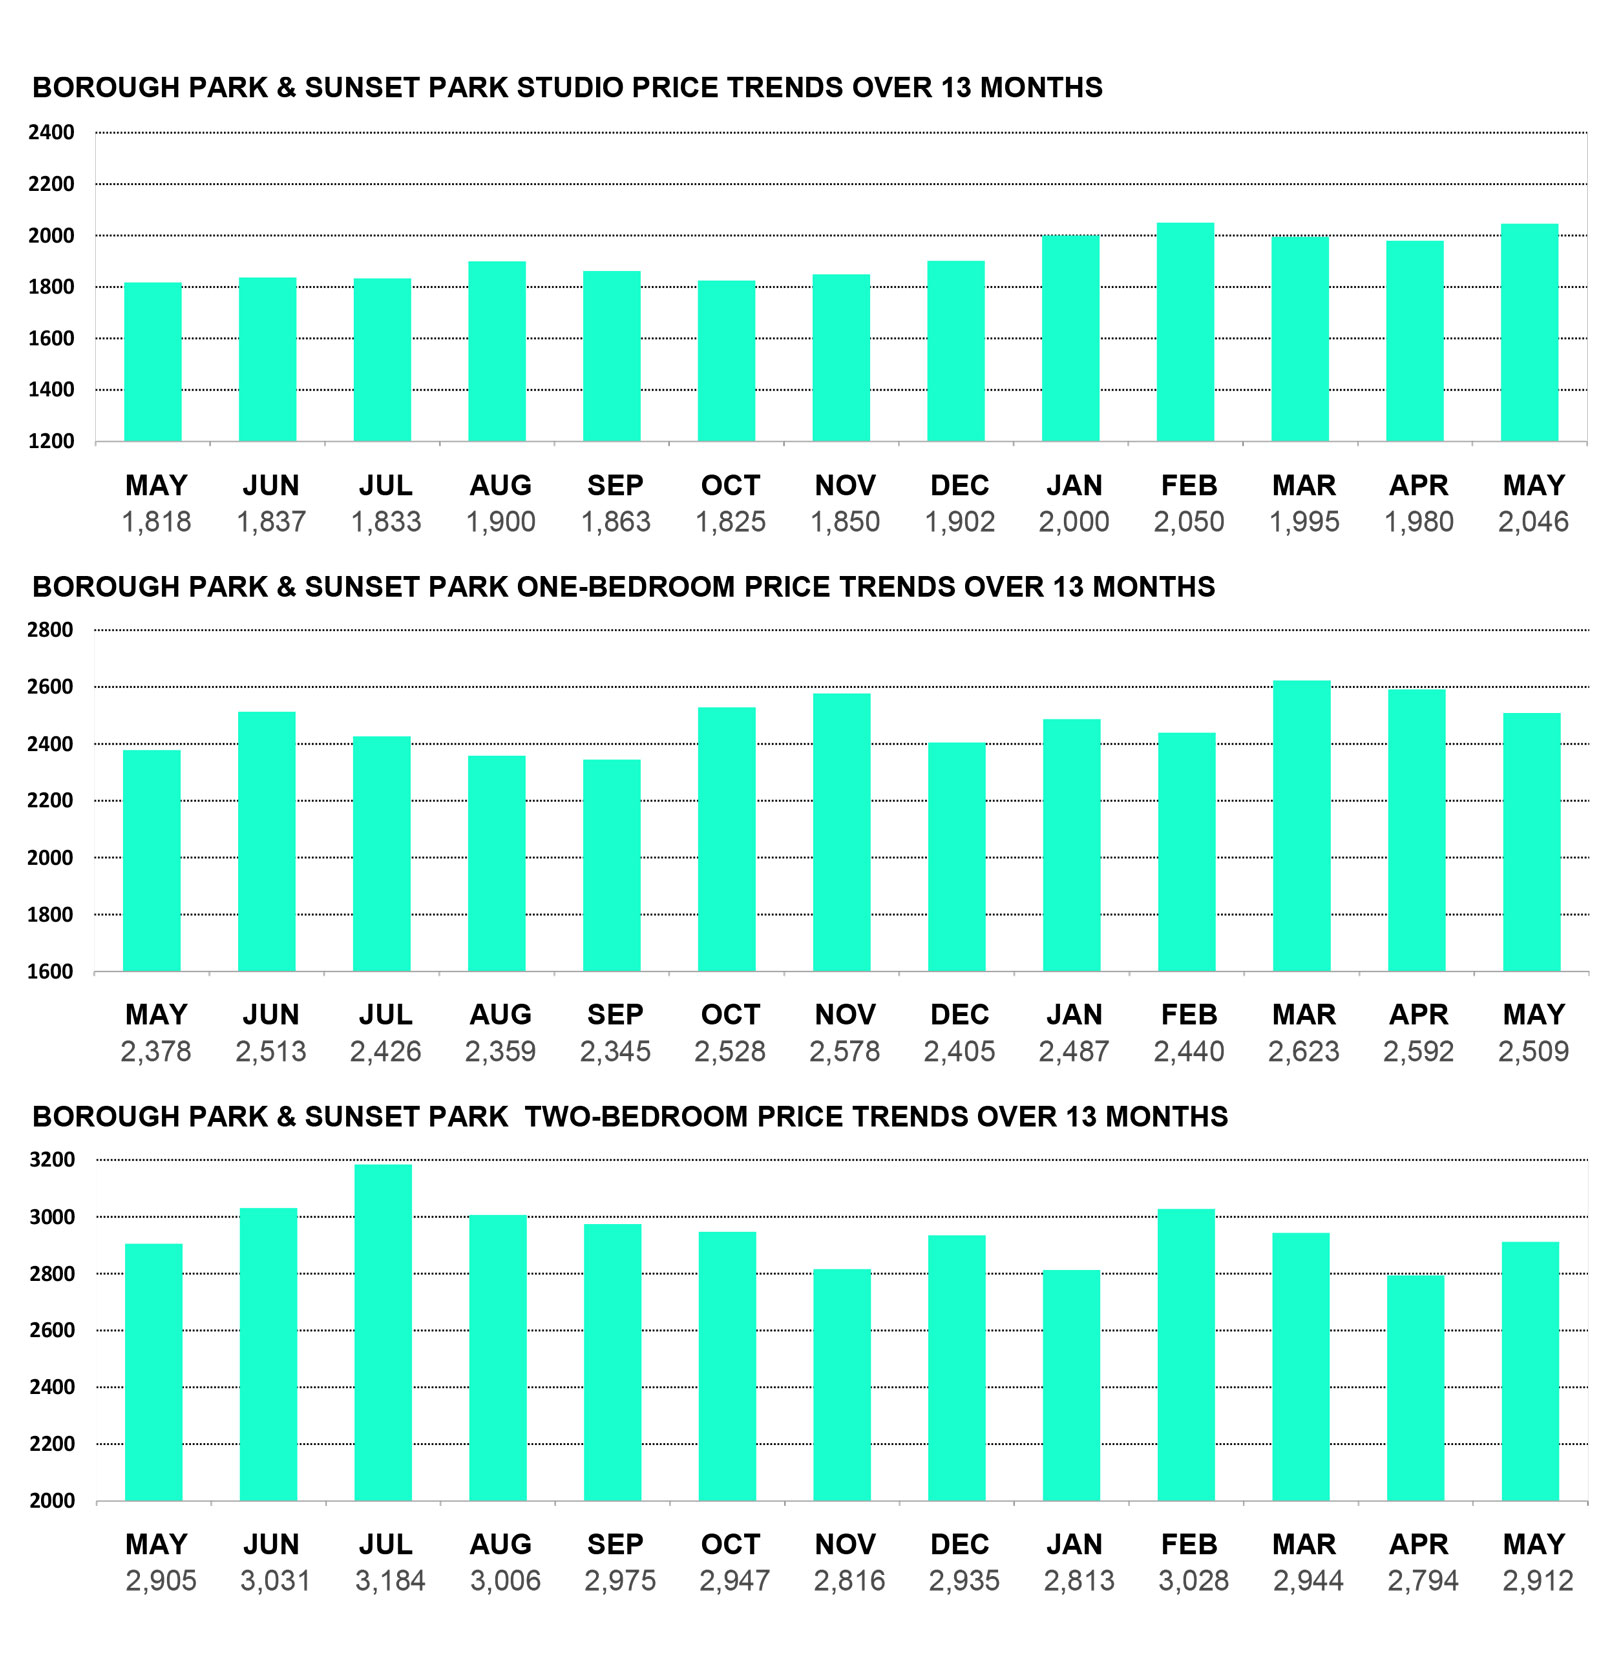
| Two bedrooms | Dumbo $7,034 | Borough Park/Sunset Park $2,912 |
WHERE PRICES DECREASED
BAY RIDGE
Studios -0.95%
One-Bedroom -3.93%
BED STUY
One-Bedroom -1.98%
BOROUGH PARK/SUNSET PARK
One-Bedroom -3.21%
BROOKLYN HEIGHTS
One-Bedroom -0.02%
CROWN HEIGHTS
Two-Bedroom -2.80%
DUMBO
One-Bedroom -1.21%
Two-Bedroom -0.53%
DOWNTOWN BROOKLYN
Two-Bedroom -1.57%
FORT GREENE
One-Bedroom -3.98%
GREENPOINT
Two-Bedroom -0.30%
PARK SLOPE
Studios -4.73%
One-Bedroom -2.95%
PLG/FLATBUSH
Two-Bedroom -2.30%
WILLIAMSBURG
Studios -0.31%
One-Bedroom -0.39%
WHERE PRICES INCREASED
BAY RIDGE
Two-Bedroom 5.11%
BED STUY
Studios 4.21%
Two-Bedroom 1.01%
BOERUM HILL
Studios 4.11%
One-Bedroom 0.42%
Two-Bedroom 5.61%
BOROUGH PARK/SUNSET PARK
Studios 3.33%
Two-Bedroom 4.22%
BROOKLYN HEIGHTS
Studios 1.11%
Two-Bedroom 0.56%
BUSHWICK
Studios 4.21%
One-Bedroom 2.72%
Two-Bedroom 3.81%
CLINTON HILL
Studios 0.88%
One-Bedroom 2.47%
Two-Bedroom 3.44%
COBBLE HILL
Studio 4.26%
One-Bedroom 6.83%
Two-Bedroom 4.61%
CROWN HEIGHTS
Studios 1.43%
One-Bedroom 2.10%
DUMBO
Studios 2.57%
DOWNTOWN BROOKLYN
Studios 0.88%
One-Bedroom 3.02%
FORT GREENE
One-Bedroom 3.02%
Two-Bedroom 5.70%
GREENPOINT
Studios 0.38%
One-Bedroom 2.13%
PARK SLOPE
Two-Bedroom 3.72%
PLG/FLATBUSH
Studios 1.42%
One-Bedroom 2.09%
WILLIAMSBURG
Two-Bedroom 7.62%
BROOKLYN AVERAGE PRICE
BROOKLYN AVERAGE PRICE
BROOKLYN AVERAGE PRICE

A QUICK LOOK
year over year PRICE CHANGE BY NEIGHBORHOOD

YEAR OVER YEAR Price change
MAY 2025 VS. MAY 2026

| TYPE | MAY 2025 | MAY 2026 | CHANGE |
|---|---|---|---|
| Studios | $3,076 | $3,130 | 1.76% |
| One bedrooms | $3,748 | $3,904 | 4.16% |
| Two bedrooms | $4,775 | $5,083 | 6.45% |
BROOKLYN PRICE TRENDS
BAY RIDGE PRICE TRENDS
THE AVERAGE RENTAL PRICE IN BAY RIDGE SLIGHTLY INCREASED BY JUST 0.57%.
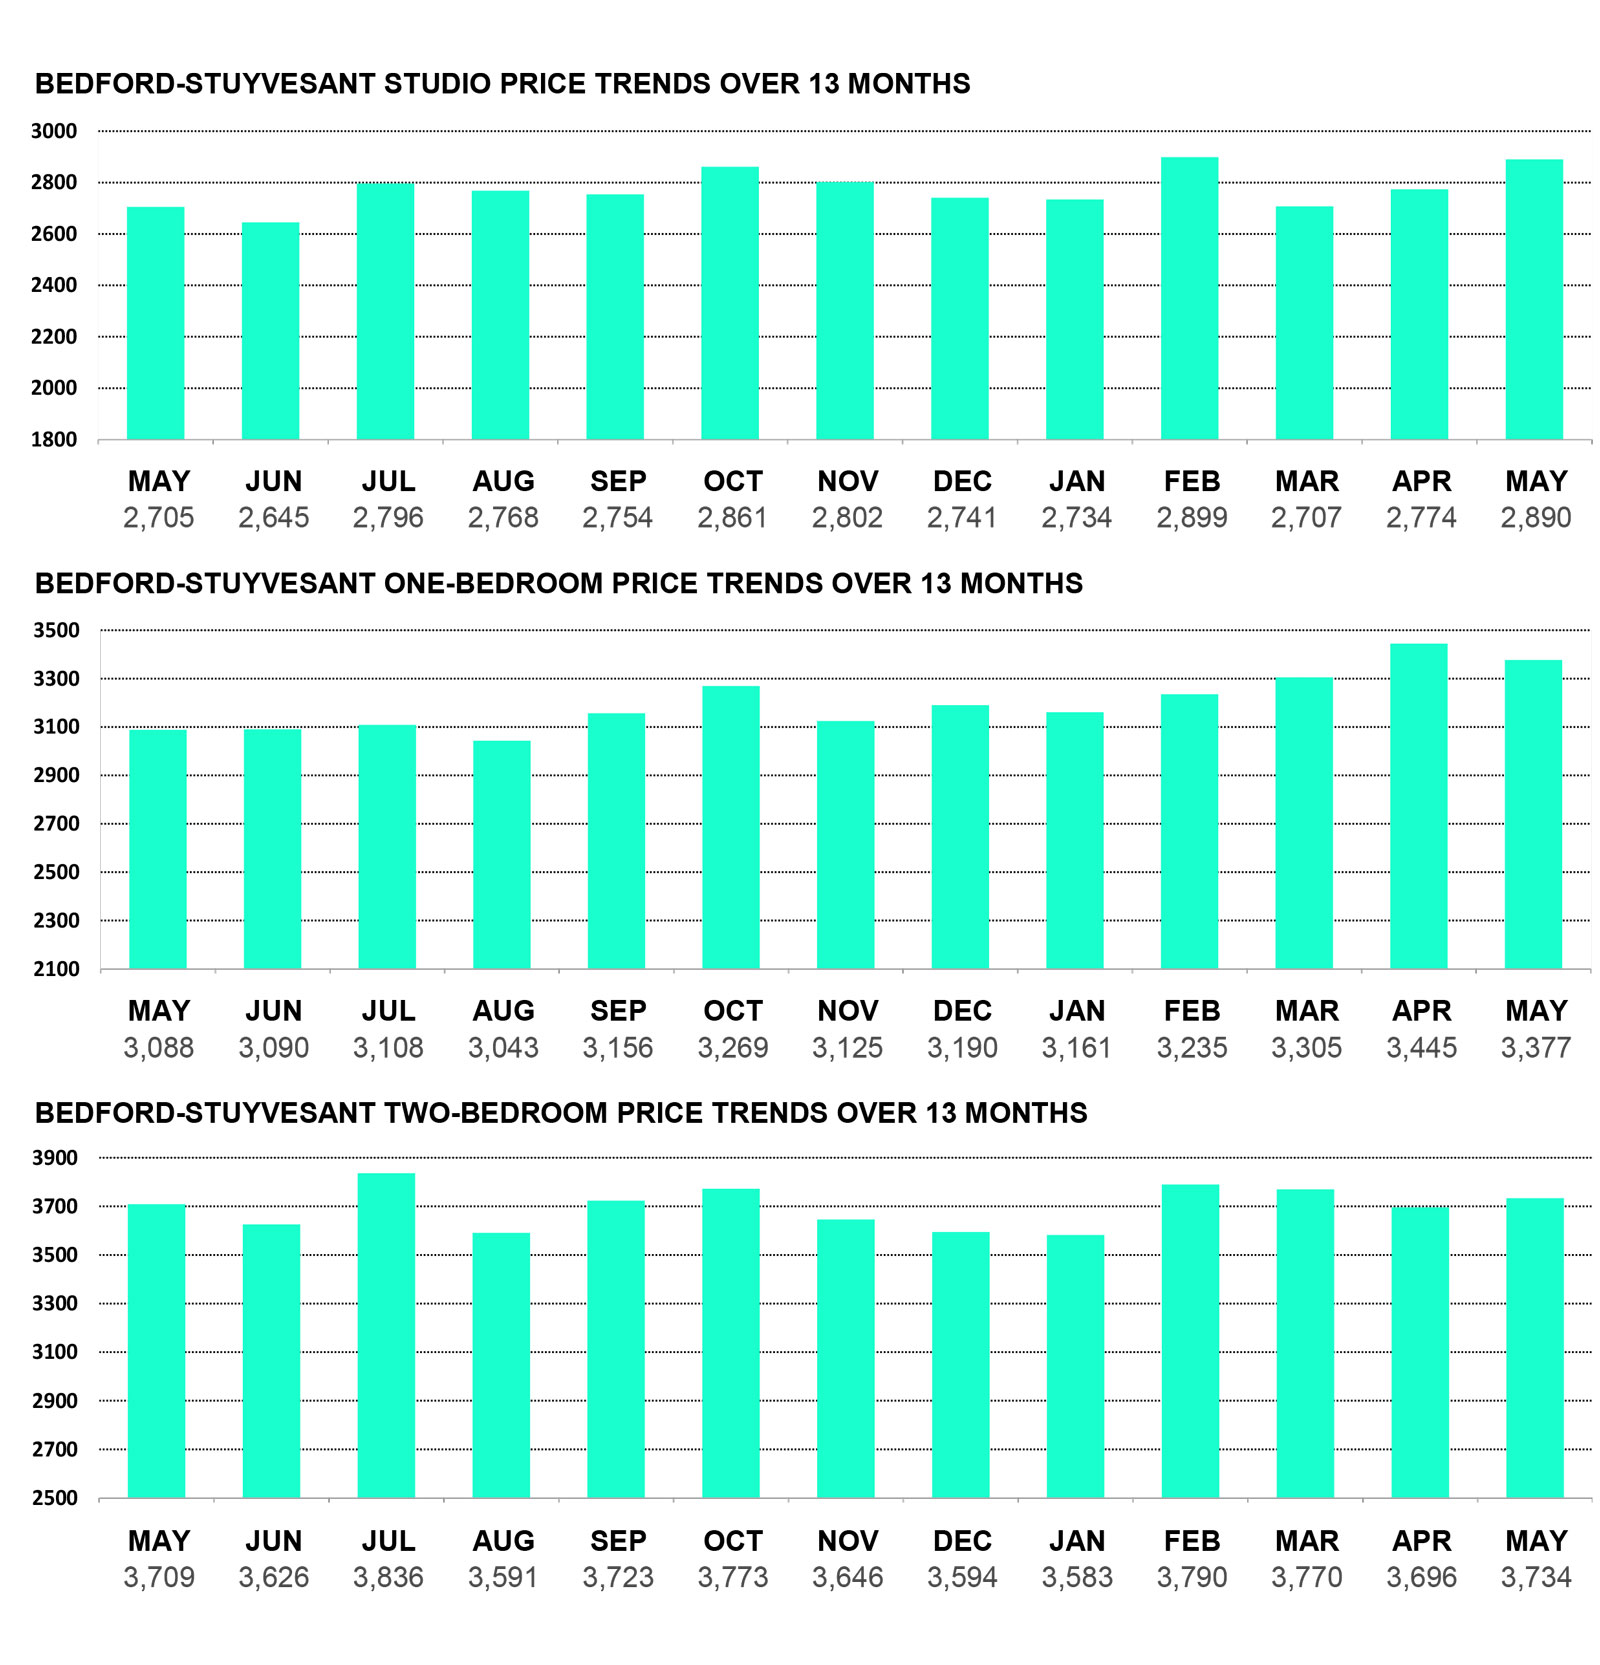
BEDFORD-STUYVESANT PRICE TRENDS
OVERALL, THE AVERAGE RENTAL PRICE IN BEDFORD-STUYVESANT SLIGHTLY INCREASED BY JUST 0.87% THIS MONTH.
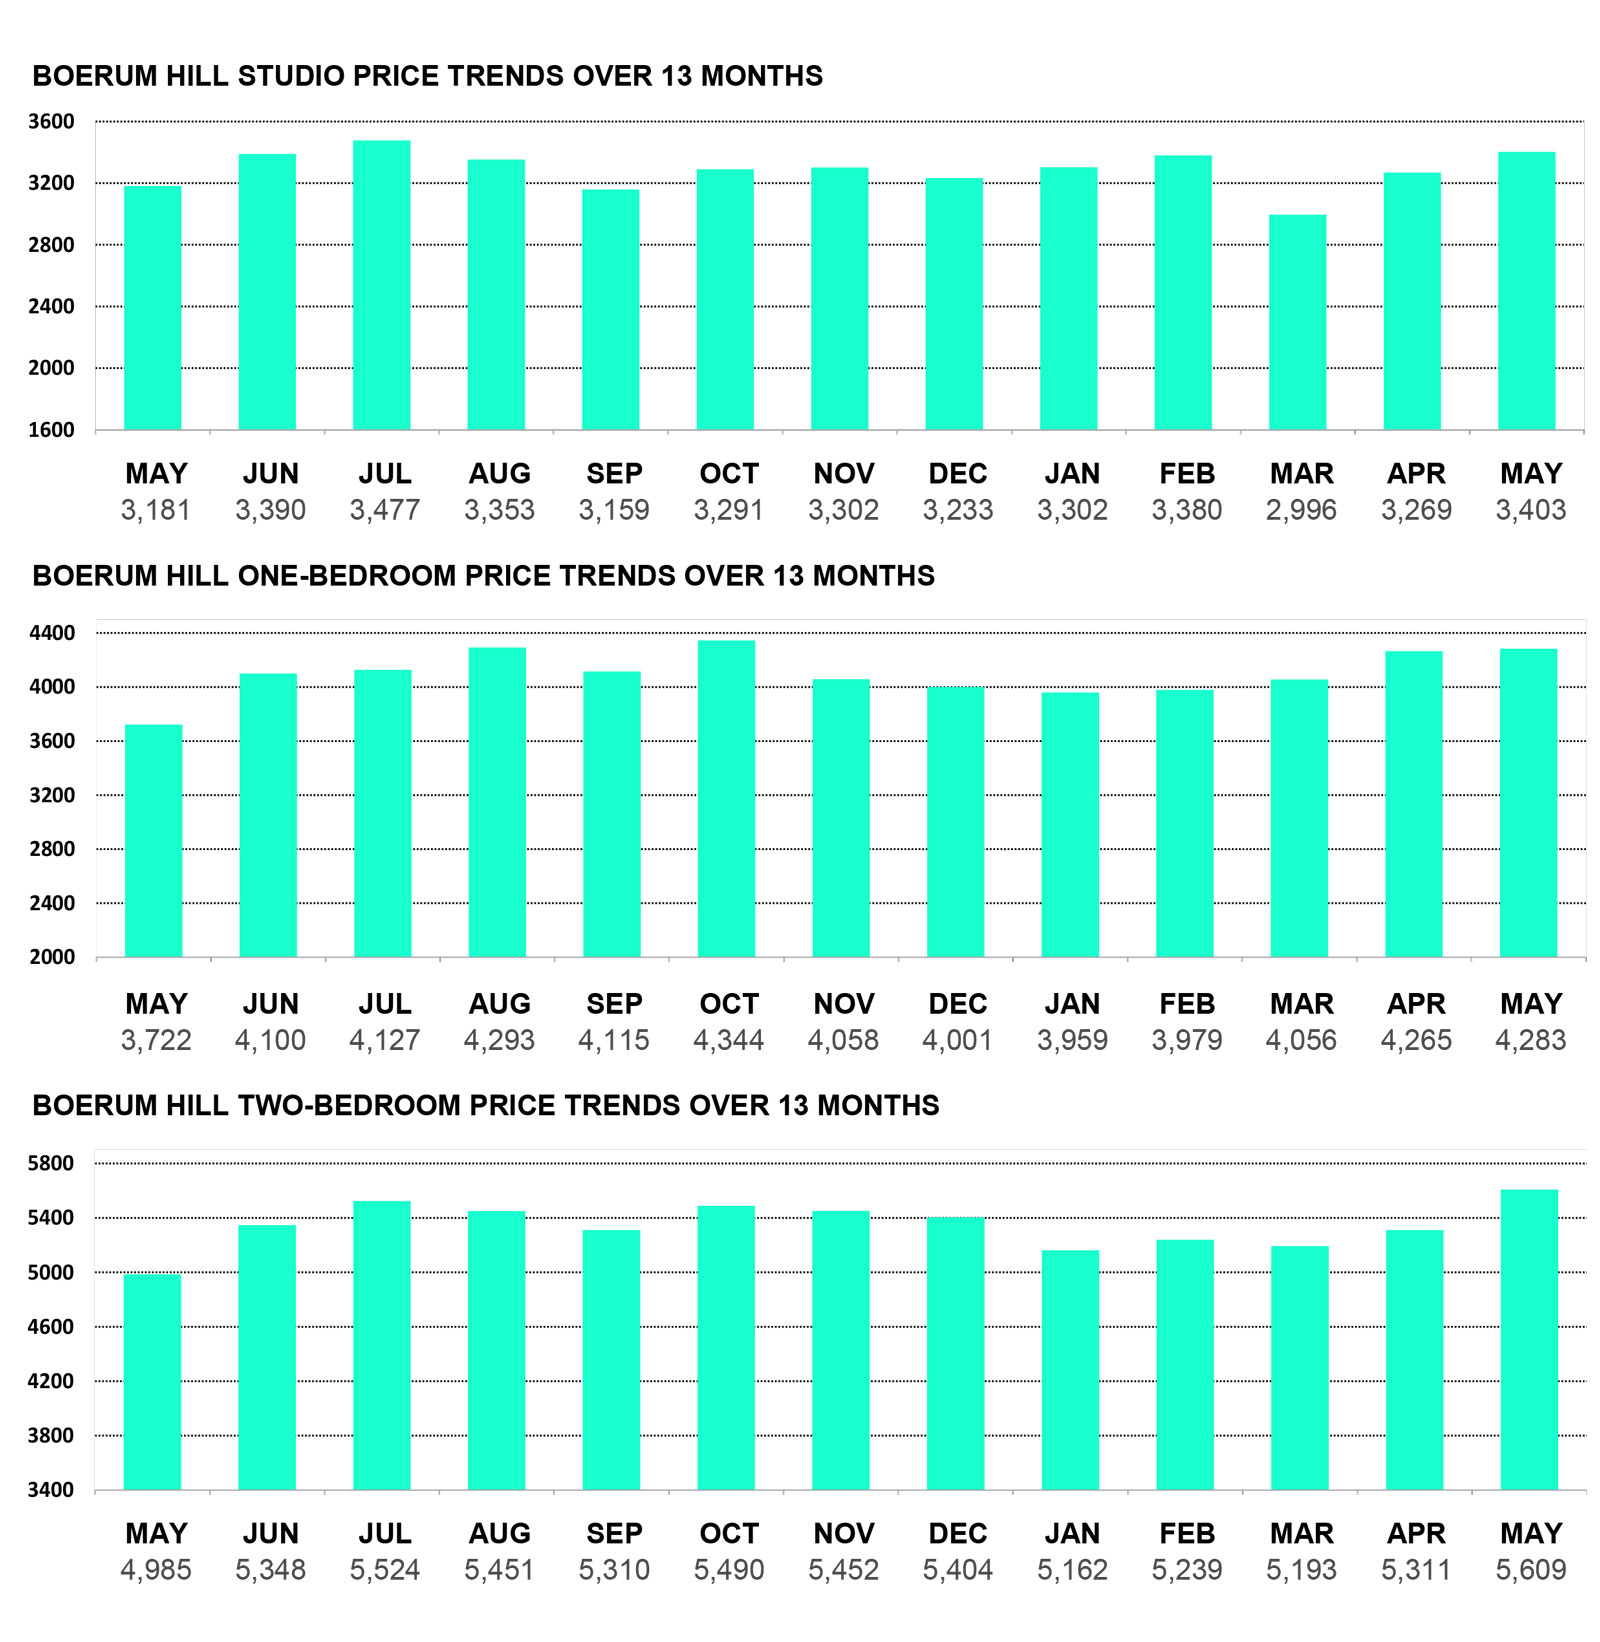
BOERUM HILL PRICE TRENDS
THE AVERAGE RENTAL PRICE IN BOERUM HILL INCREASED BY 3.50%.
BOROUGH/SUNSET PARK PRICE TRENDS
OVER THE PAST MONTH, THE AVERAGE RENTAL PRICE IN BOROUGH PARK / SUNSET PARK INCREASED BY 1.37%.
BROOKLYN HEIGHTS PRICE TRENDS
THE AVERAGE RENTAL PRICE IN BROOKLYN HEIGHTS THIS PAST MONTH SLIGHTLY INCREASED BY JUST 0.51%.
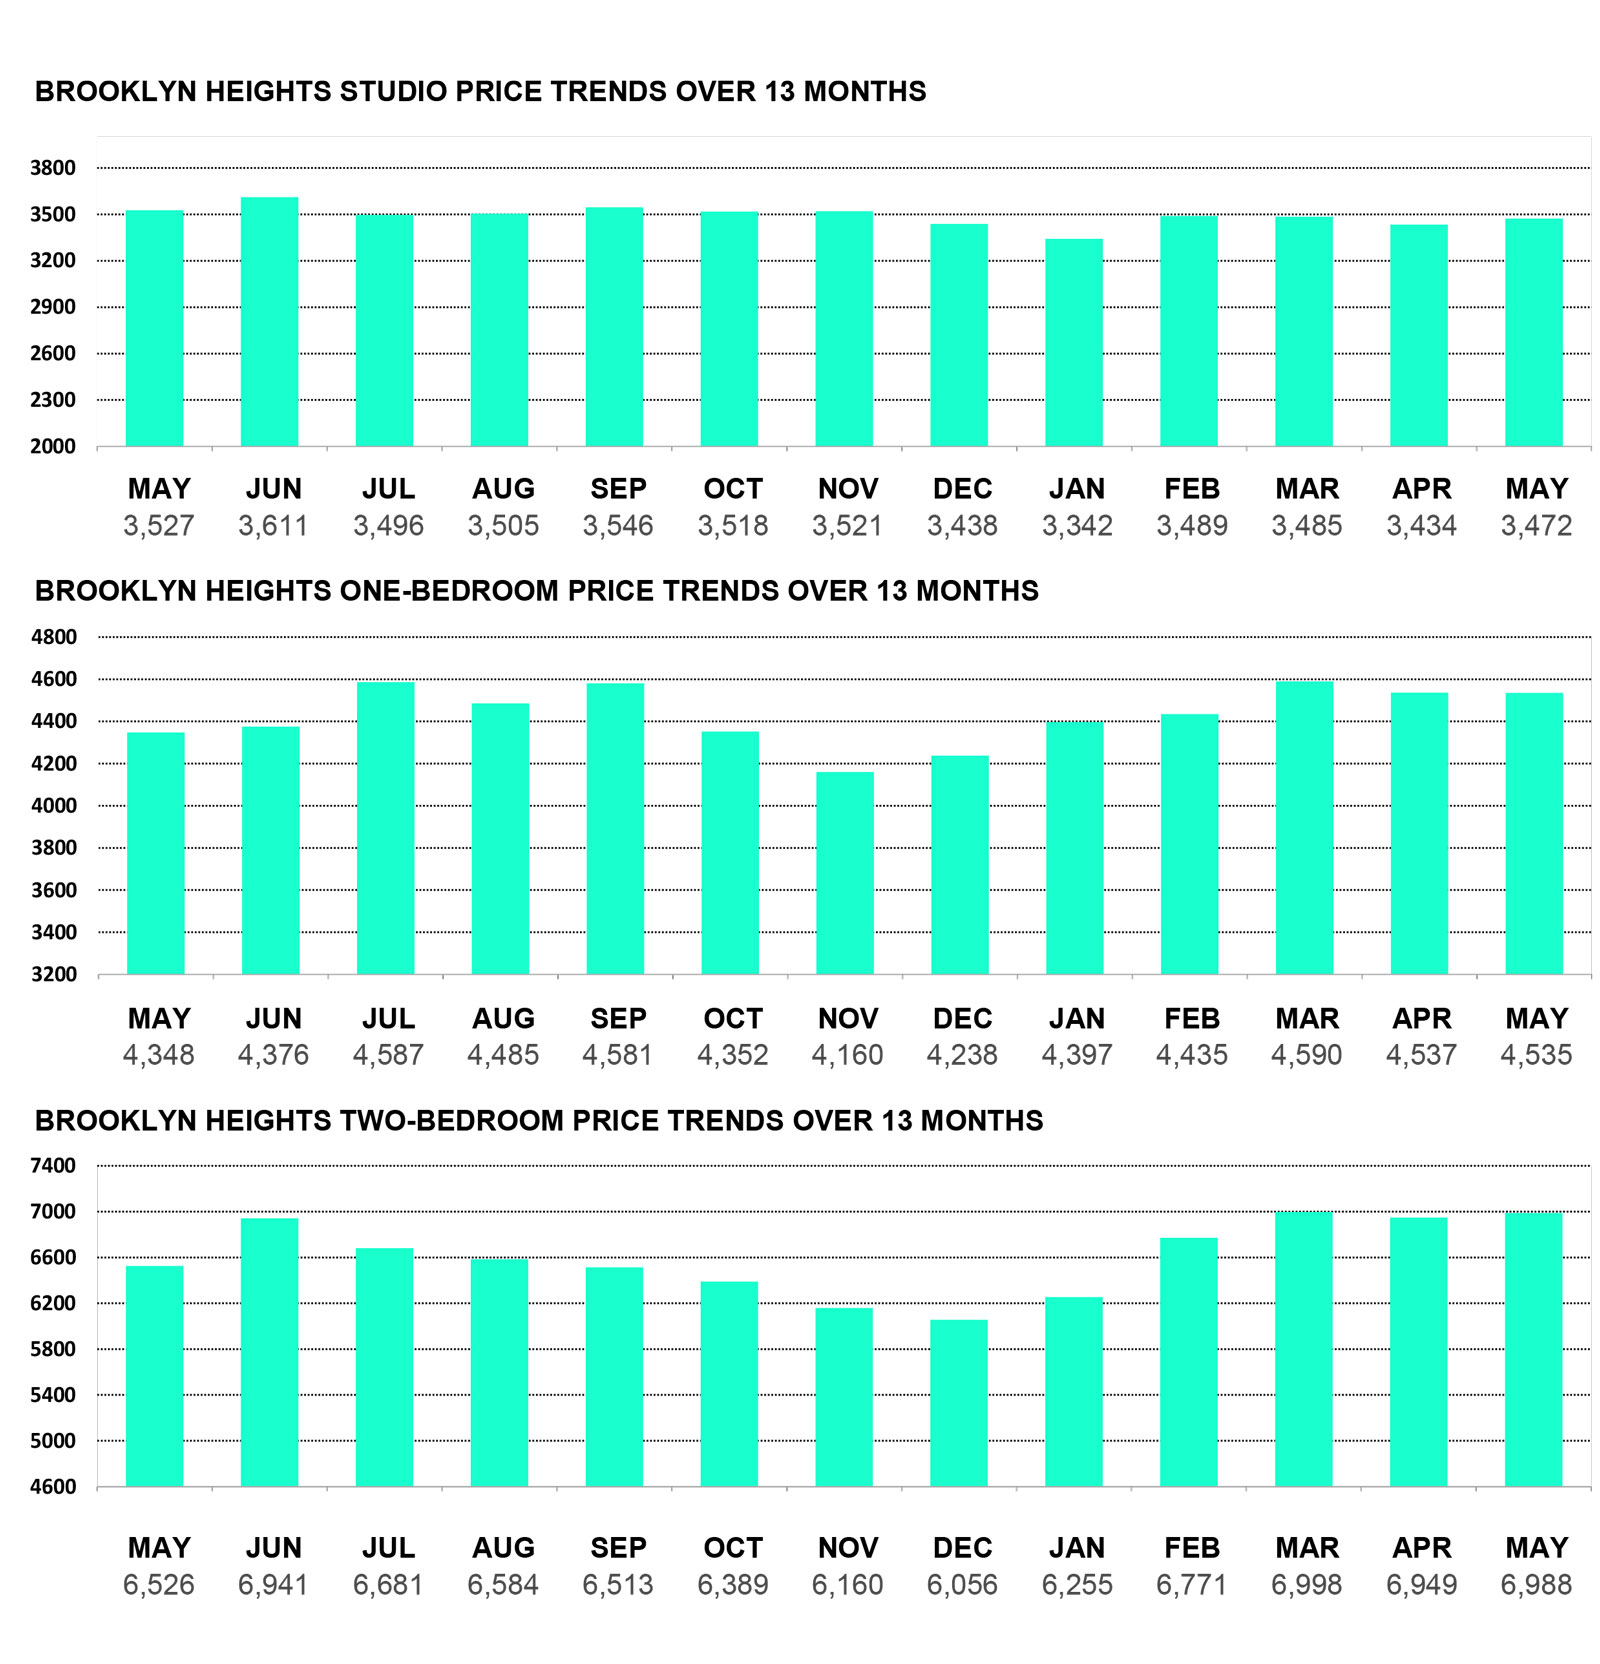
BUSHWICK PRICE TRENDS
THE AVERAGE RENTAL PRICE IN BUSHWICK INCREASED BY 3.57% OVER THE PAST MONTH.
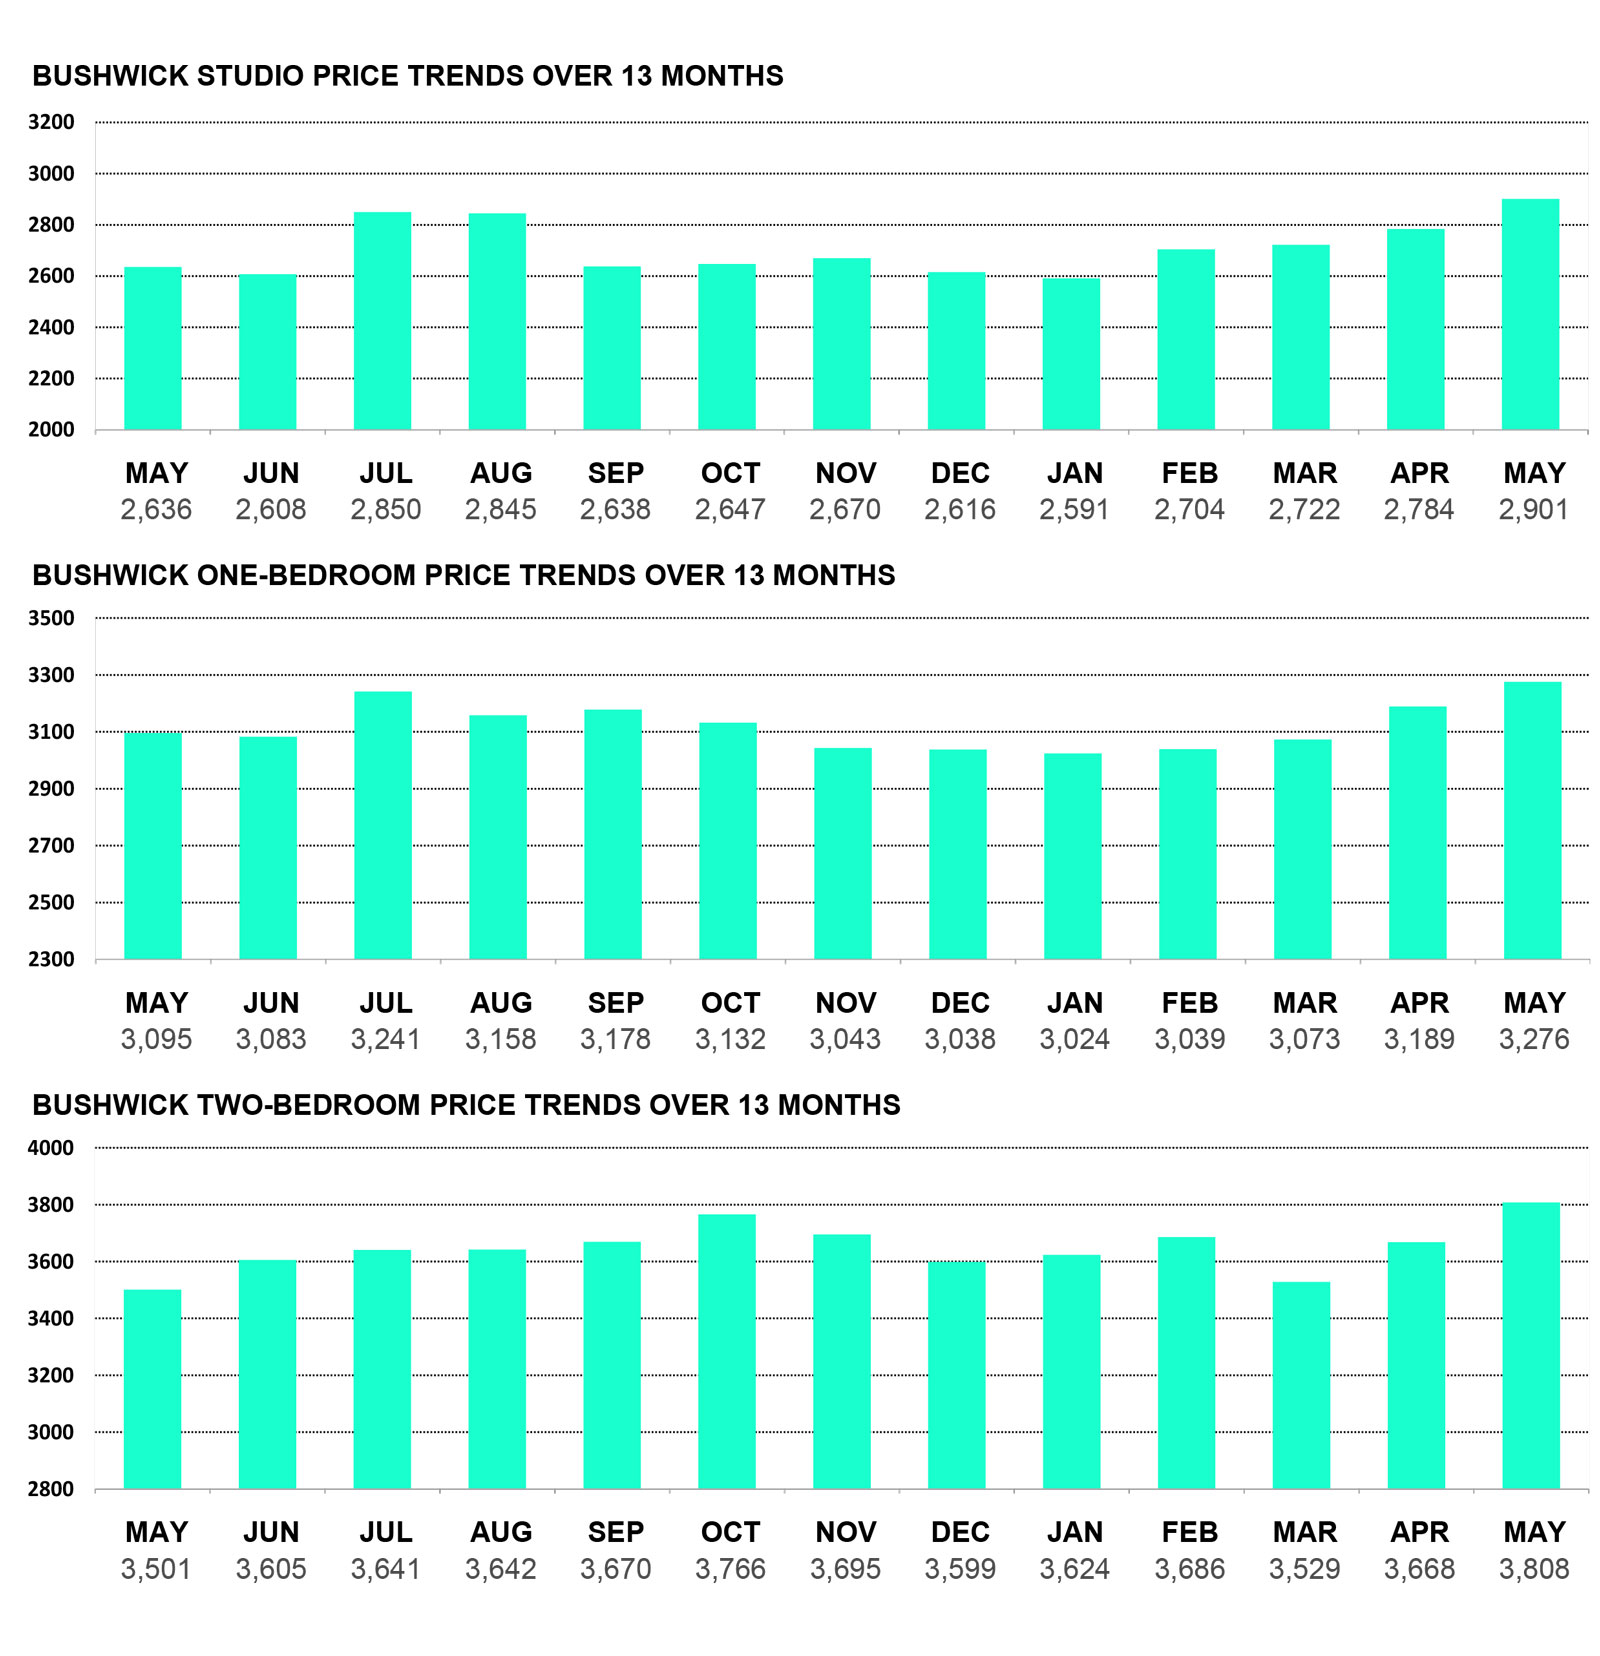
CLINTON HILL PRICE TRENDS
THE AVERAGE RENTAL PRICE IN CLINTON HILL INCREASED BY 2.49% THIS PAST MONTH.
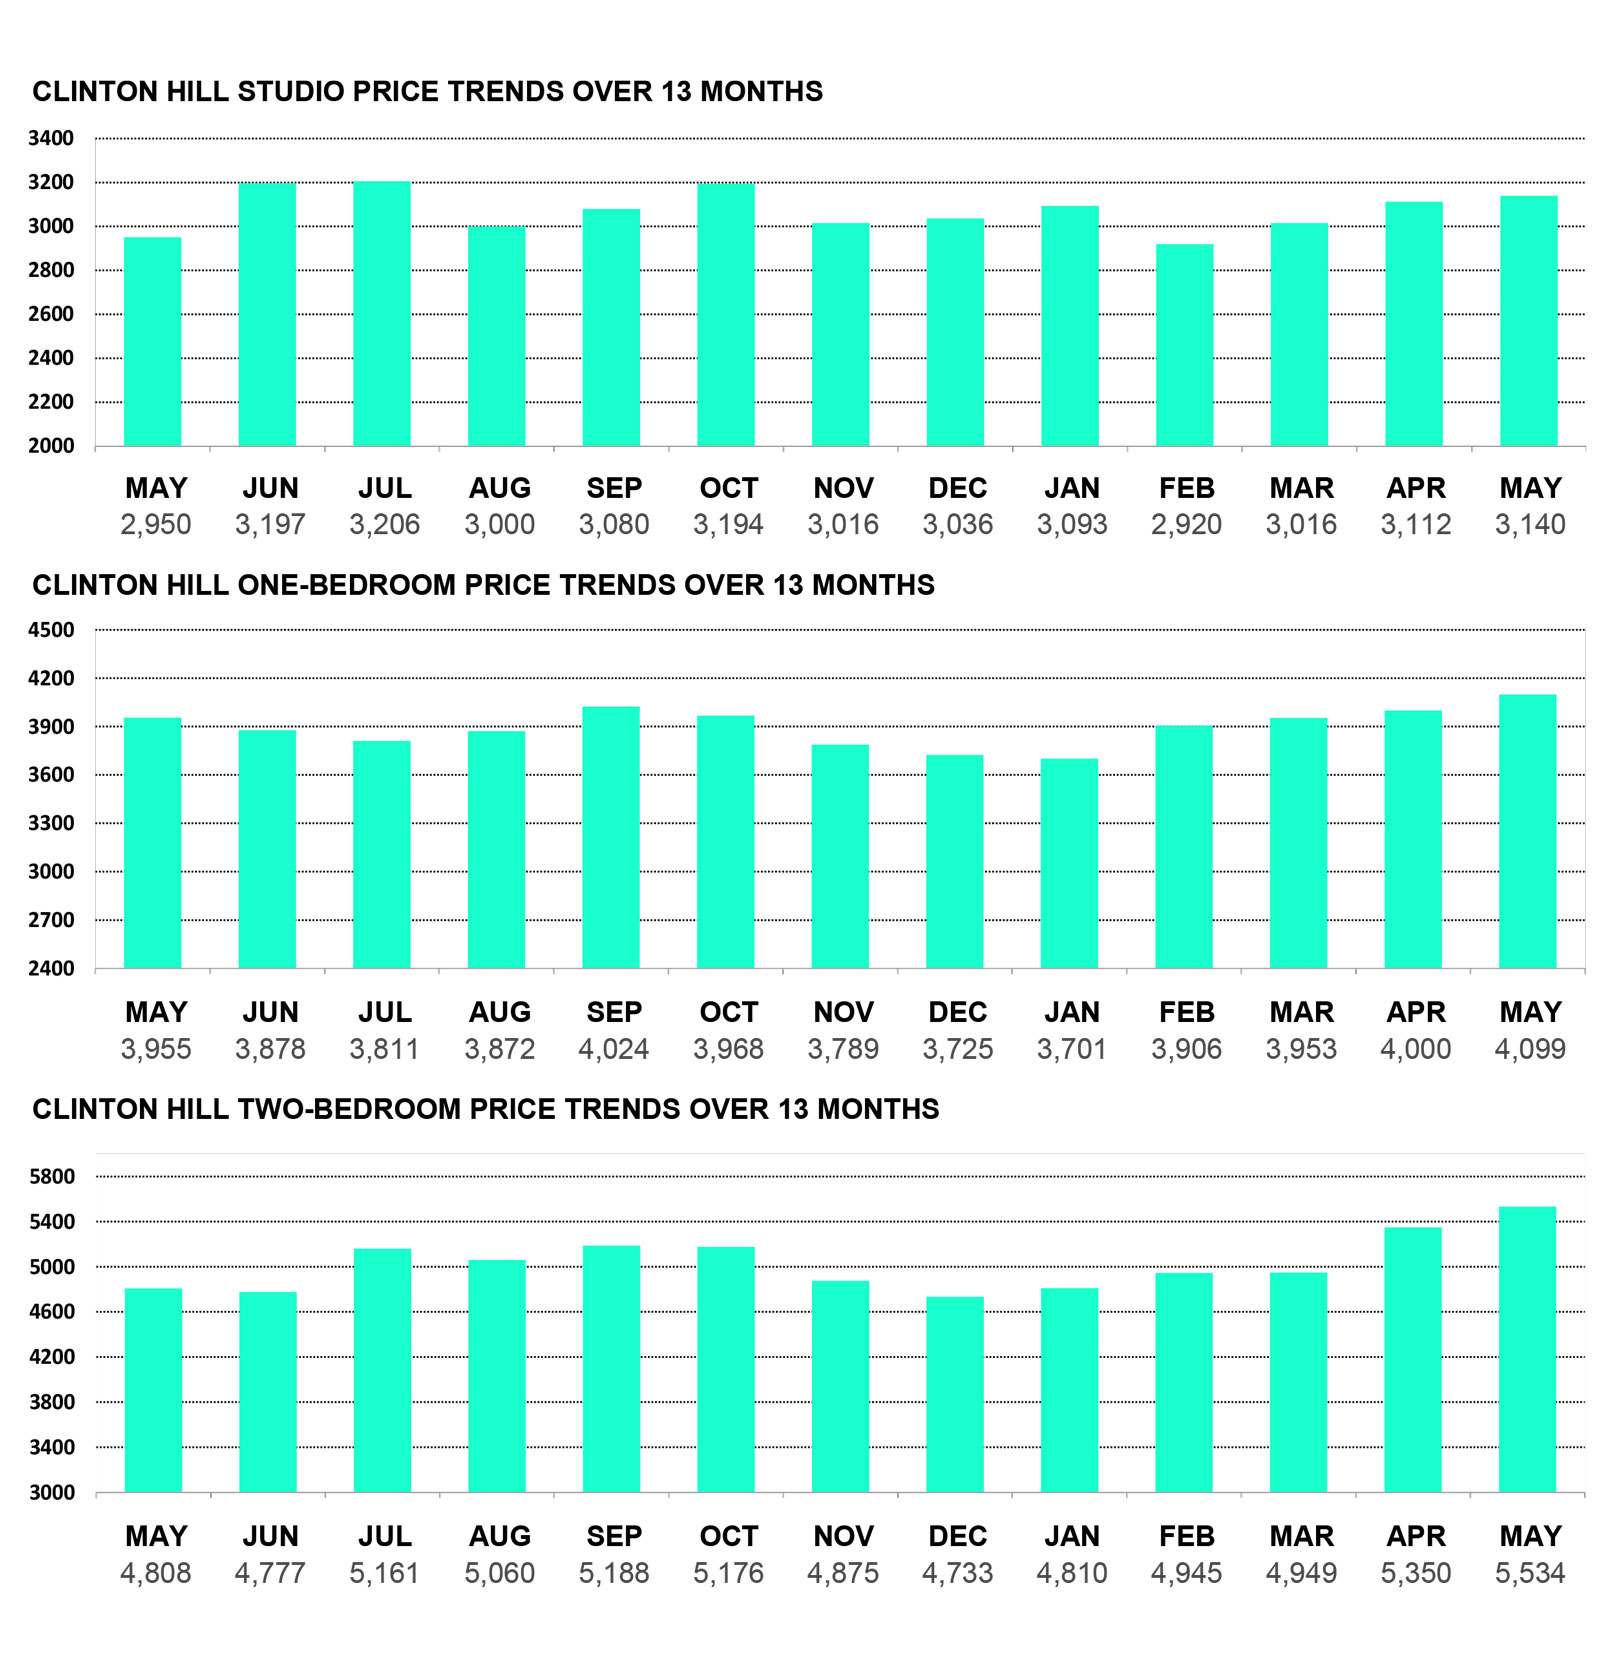
COBBLE HILL PRICE TRENDS
OVER THIS PAST MONTH, THE AVERAGE RENTAL PRICE IN COBBLE HILL INCREASED BY 5.30%.
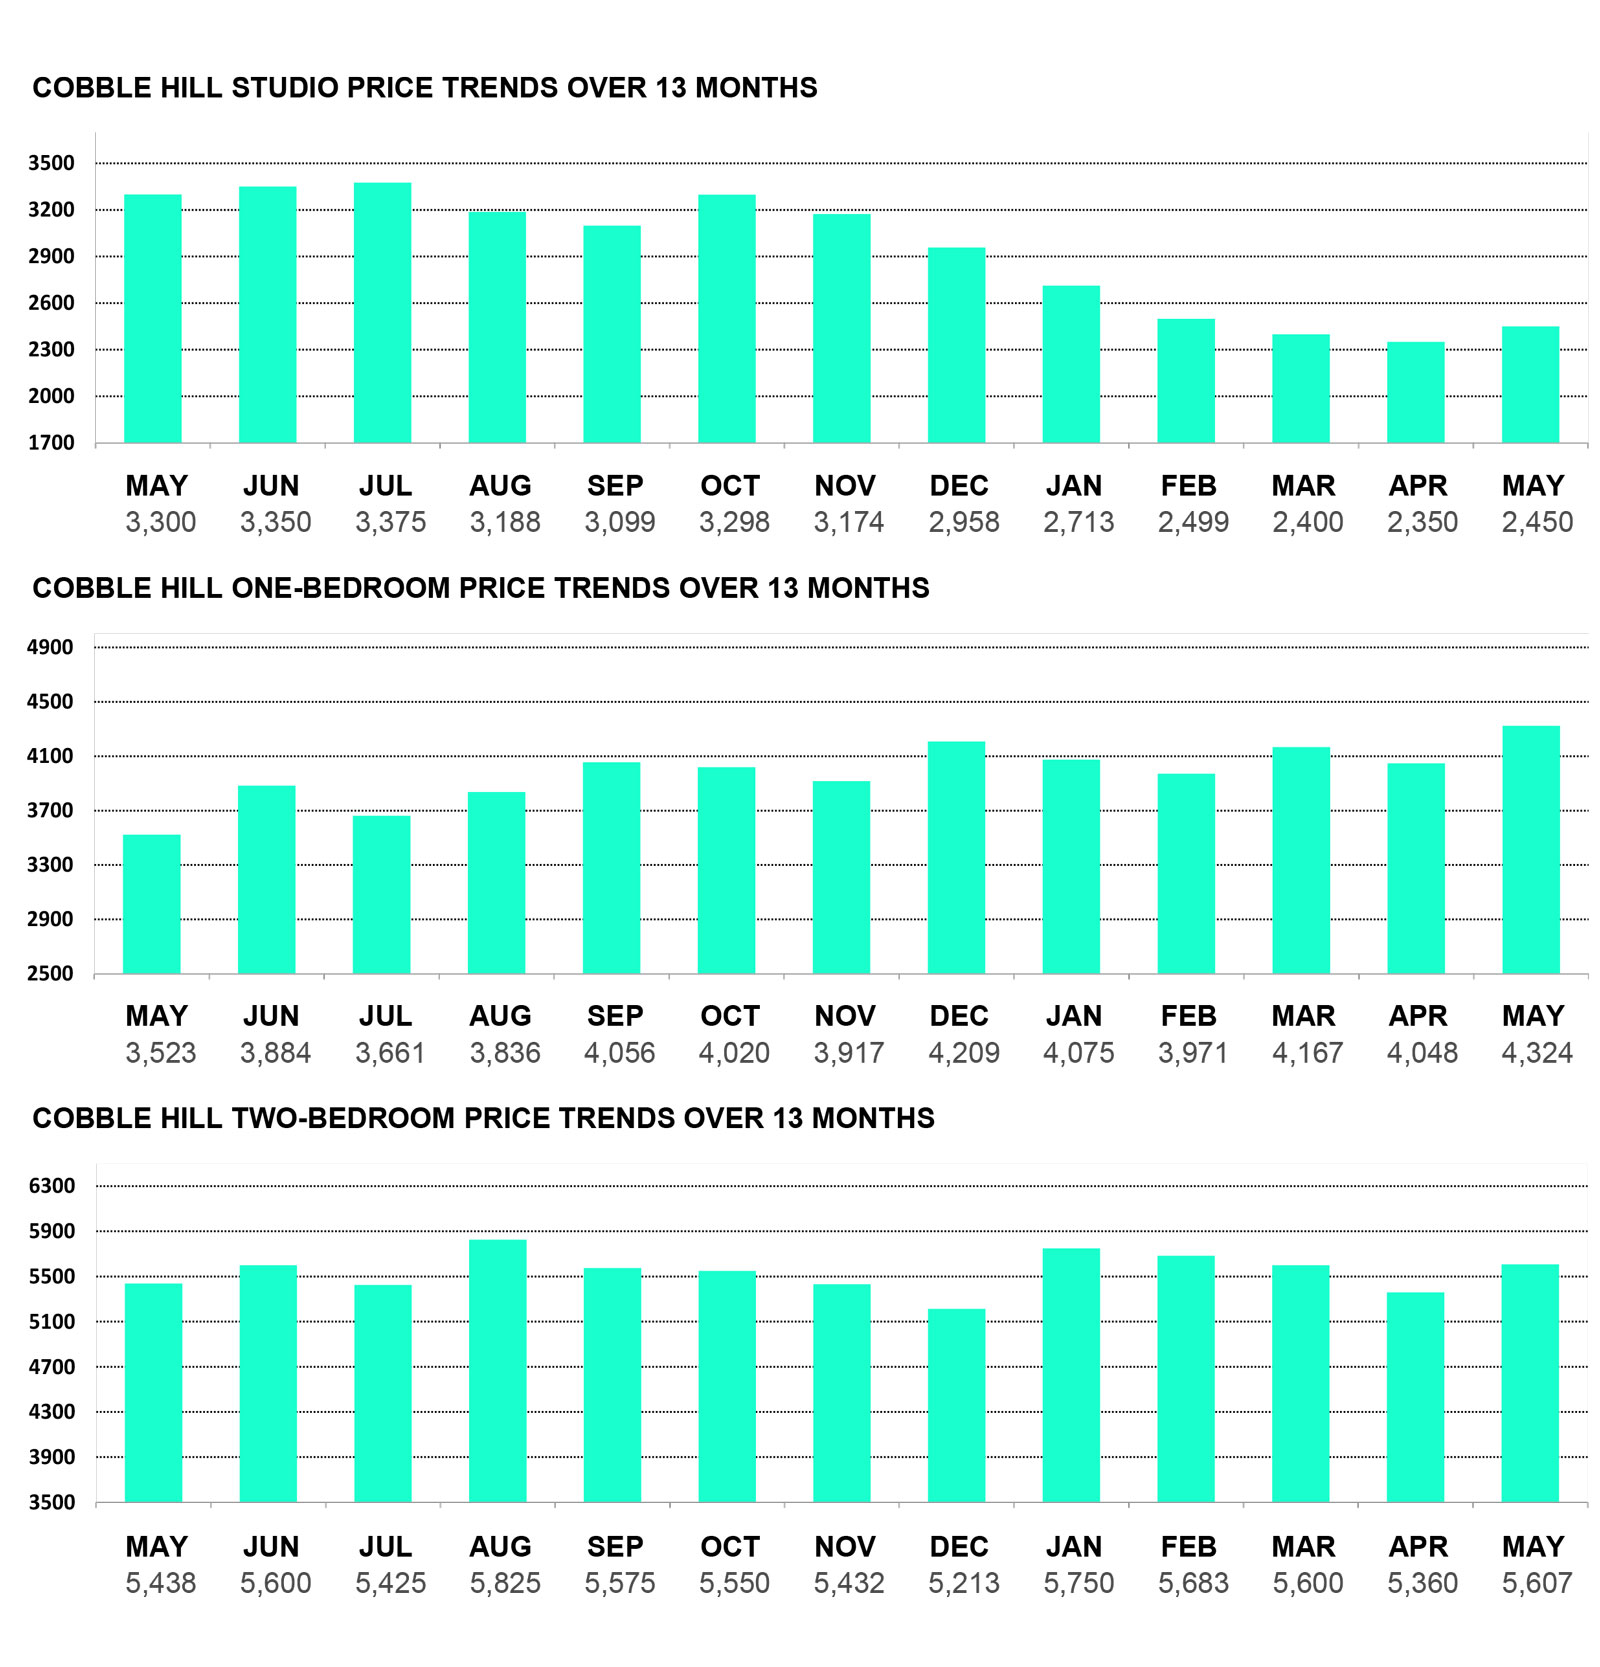
CROWN HEIGHTS PRICE TRENDS
CROWN HEIGHTS RENTS SLIGHTLY INCREASED THIS MONTH BY JUST 0.01%.
DOWNTOWN BROOKLYN PRICE TRENDS
AVERAGE RENTS THIS MONTH IN DOWNTOWN BROOKLYN SLIGHTLY INCREASED BY JUST 0.51%.
DUMBO PRICE TRENDS
MONTH-OVER-MONTH, RENTS IN DUMBO SLIGHTLY INCREASED BY JUST 0.02%.
FORT GREENE PRICE TRENDS
THE AVERAGE RENTAL PRICE IN FORT GREENE INCREASED BY 1.84% THIS PAST MONTH.
GREENPOINT PRICE TRENDS
OVER THE PAST MONTH, AVERAGE RENTAL PRICE IN GREENPOINT SLIGHTLY INCREASED BY JUST 0.66%.
PARK SLOPE PRICE TRENDS
AVERAGE RENTS IN PARK SLOPE SLIGHTLY DECREASED BY JUST 0.58% THIS PAST MONTH.
PLG/FLATBUSH PRICE TRENDS
THE AVERAGE RENTAL PRICE IN PLG / FLATBUSH SLIGHTLY INCREASED BY JUST 0.19% OVER THE PAST MONTH.
WILLIAMSBURG PRICE TRENDS
THE AVERAGE RENTAL PRICE IN WILLIAMSBURG INCREASED BY 2.66% THIS PAST MONTH.
THE REPORT EXPLAINED
THE BROOKLYN RENTAL MARKET REPORTTM COMPARES FLUCTUATION IN THE BOROUGH’S RENTAL DATA ON A MONTHLY BASIS. IT IS AN ESSENTIAL TOOL FOR POTENTIAL RENTERS SEEKING TRANSPARENCY IN THE BROOKLYN APARTMENT MARKET AND A BENCHMARK FOR LANDLORDS TO EFFCIENTLY AND FAIRLY ADJUST INDIVIDUAL PROPERTY RENTS IN BROOKLYN.
The Brooklyn Rental Market Report TM is based on a cross-section of data from available listings and priced under $10,000, with ultraluxury property omitted to obtain a true monthly rental average. Our data is aggregated from the MNS proprietary database and sampled from a specifc mid-month point to record current rental rates offered by landlords during that particular month. It is then combined with information from the REBNY Real Estate Listings Source (RLS), OnLine Residential (OLR.com) and R.O.L.E.X. (Real Plus).
Author: MNS has been helping Brooklyn landlords and renters navigate the rental market since 1999. From large companies to individuals, MNS tailors services to meet your needs. Contact us today to see how we can help.
Contact Us Now: 718-222-0211
Note: All market data is collected and compiled by MNS’s marketing department. The information presented here is intended for instructive purposes only and has been gathered from sources deemed reliable, though it may be subject to errors, omissions, changes or withdrawal without notice.
If you would like to republish this report on the web, please be sure to source it as the “Brooklyn Rental Market Report” with a link back to its original location.