BROOKLYN NEW DEVELOPMENT MARKET REPORT

BROOKLYN NEW DEVELOPMENT MARKET REPORT ARCHIVE
sign up for Sponsor Sale reports to be sent to your email
TABLE OF CONTENTS
JUMP TO A PARTICULAR SECTION
INTRODUCTION
MNS IS PROUD TO PRESENT THE FIRST QUARTER 2024 EDITION OF OUR NEW DEVELOPMENT MARKET REPORT.
New Development Sales data, defined as “Arms-Length” first offering transactions where the seller is considered a “Sponsor”, was compiled from the Automated City Register Information System (ACRIS) for sponsor sales that traded during the First Quarter of 2024 (1/1/24– 3/31/24). All data is summarized on a median basis.
MARKET SNAPSHOT

10.4%
YEAR-OVER-YEAR
MEDIAN PPSF
8.2%
QUARTER-OVER-QUARTER
MEDIAN PPSF
14.6%
YEAR-OVER-YEAR
MEDIAN SALES PRICE
0.4%
QUARTER-OVER-QUARTER
MEDIAN SALES PRICE
BROOKLYN NEW DEVELOPMENT SPONSOR SALES
NEIGHBORHOOD WITH THE MOST NEW DEV SALES
GREENPOINT
18.5% of Brooklyn New Dev Sales
TOTAL NEW DEVELOPMENT SALES VOLUME
$334,674,528 in 4Q23
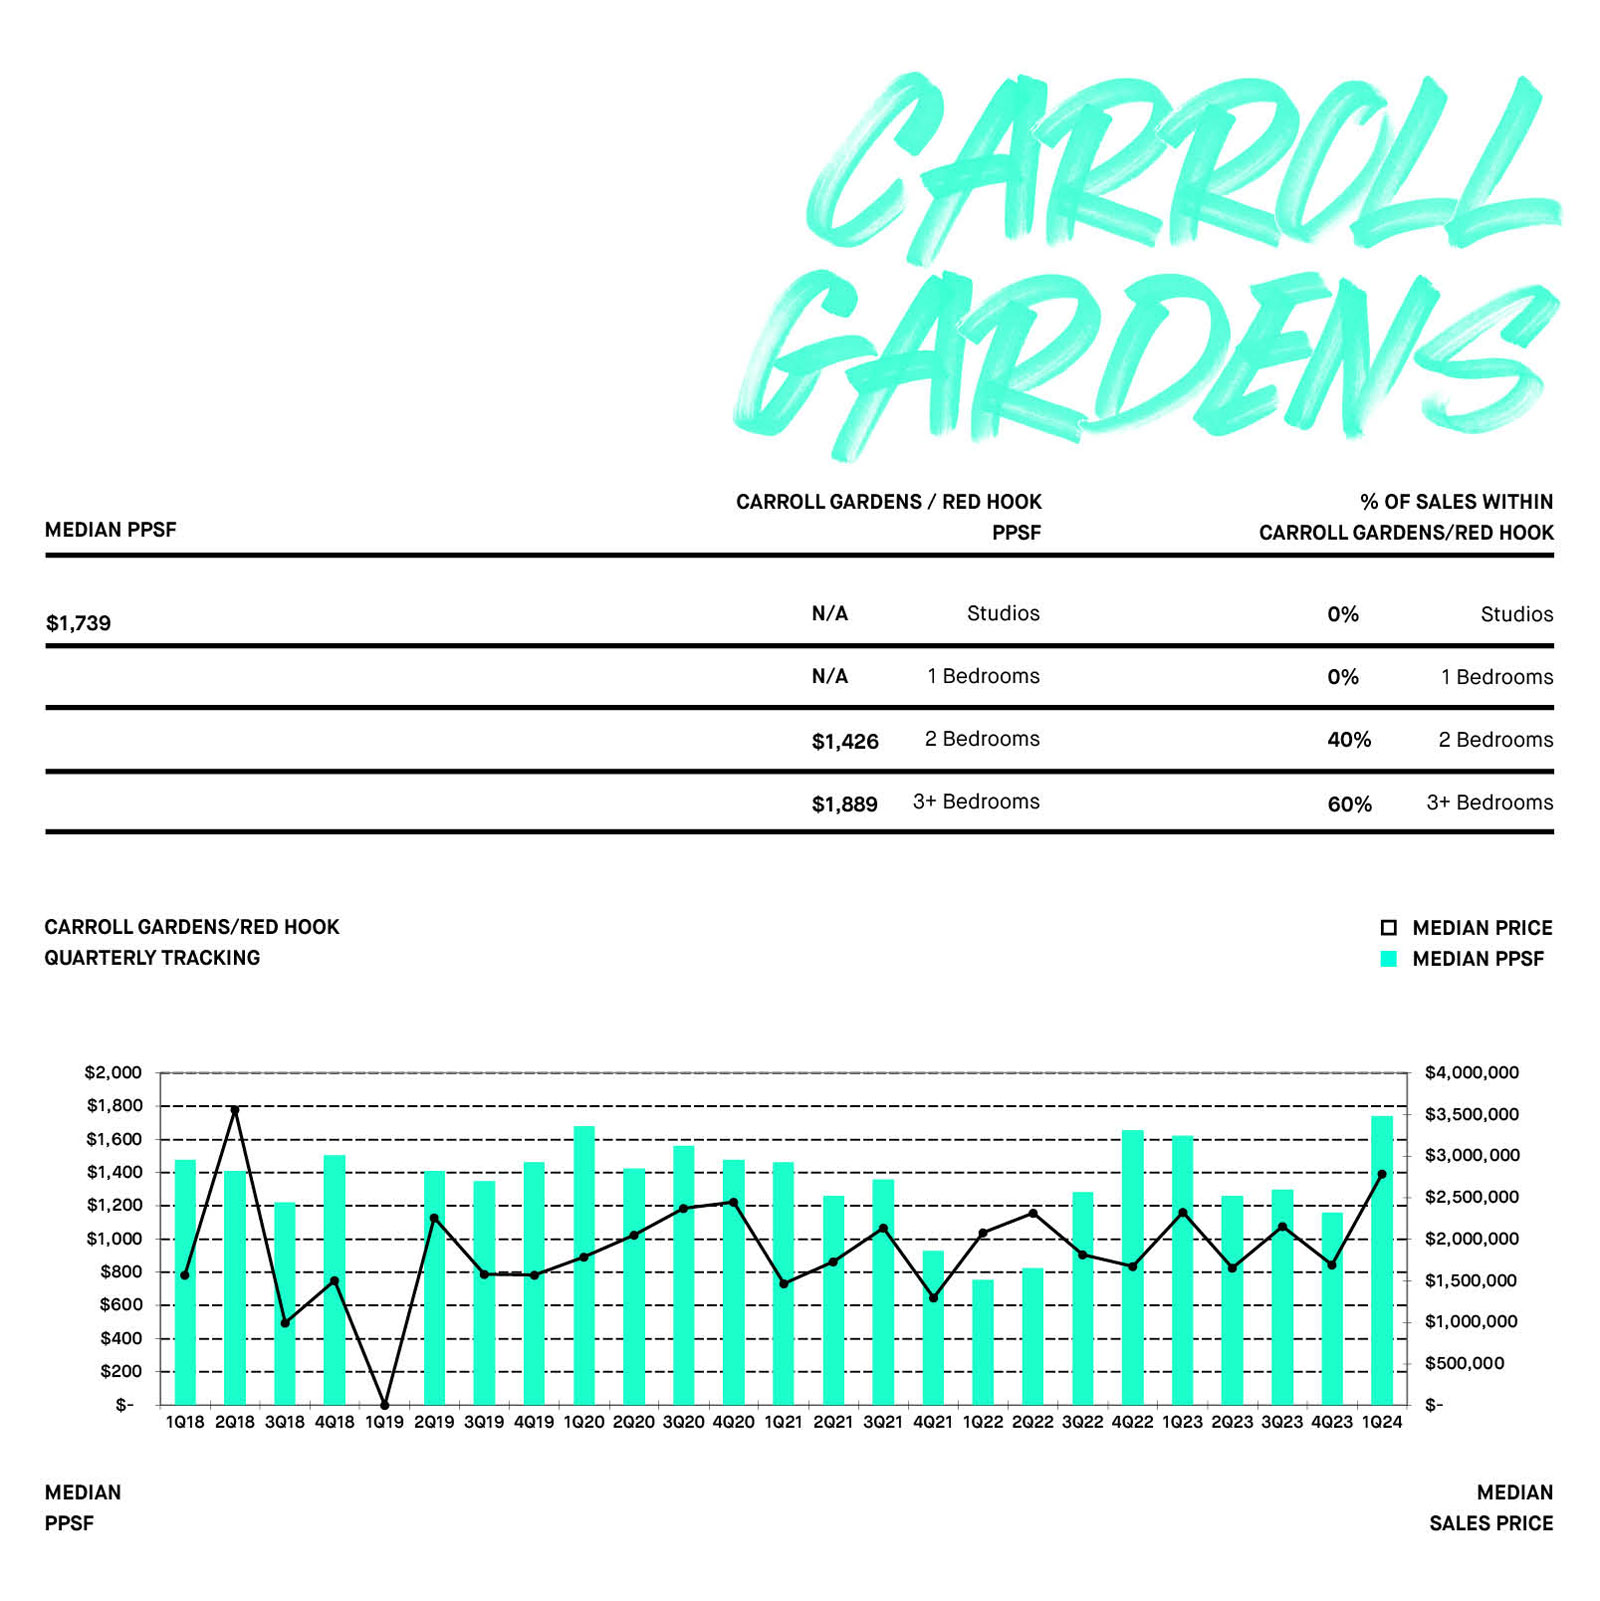
LARGEST QUARTERLY UP-SWING
CARROLL GARDENS / RED HOOK
PPSF $1,739/SF from $1,158/SF
Sales Price $2,785,000 from $1,694,586
LARGEST QUARTERLY DOWN-SWING
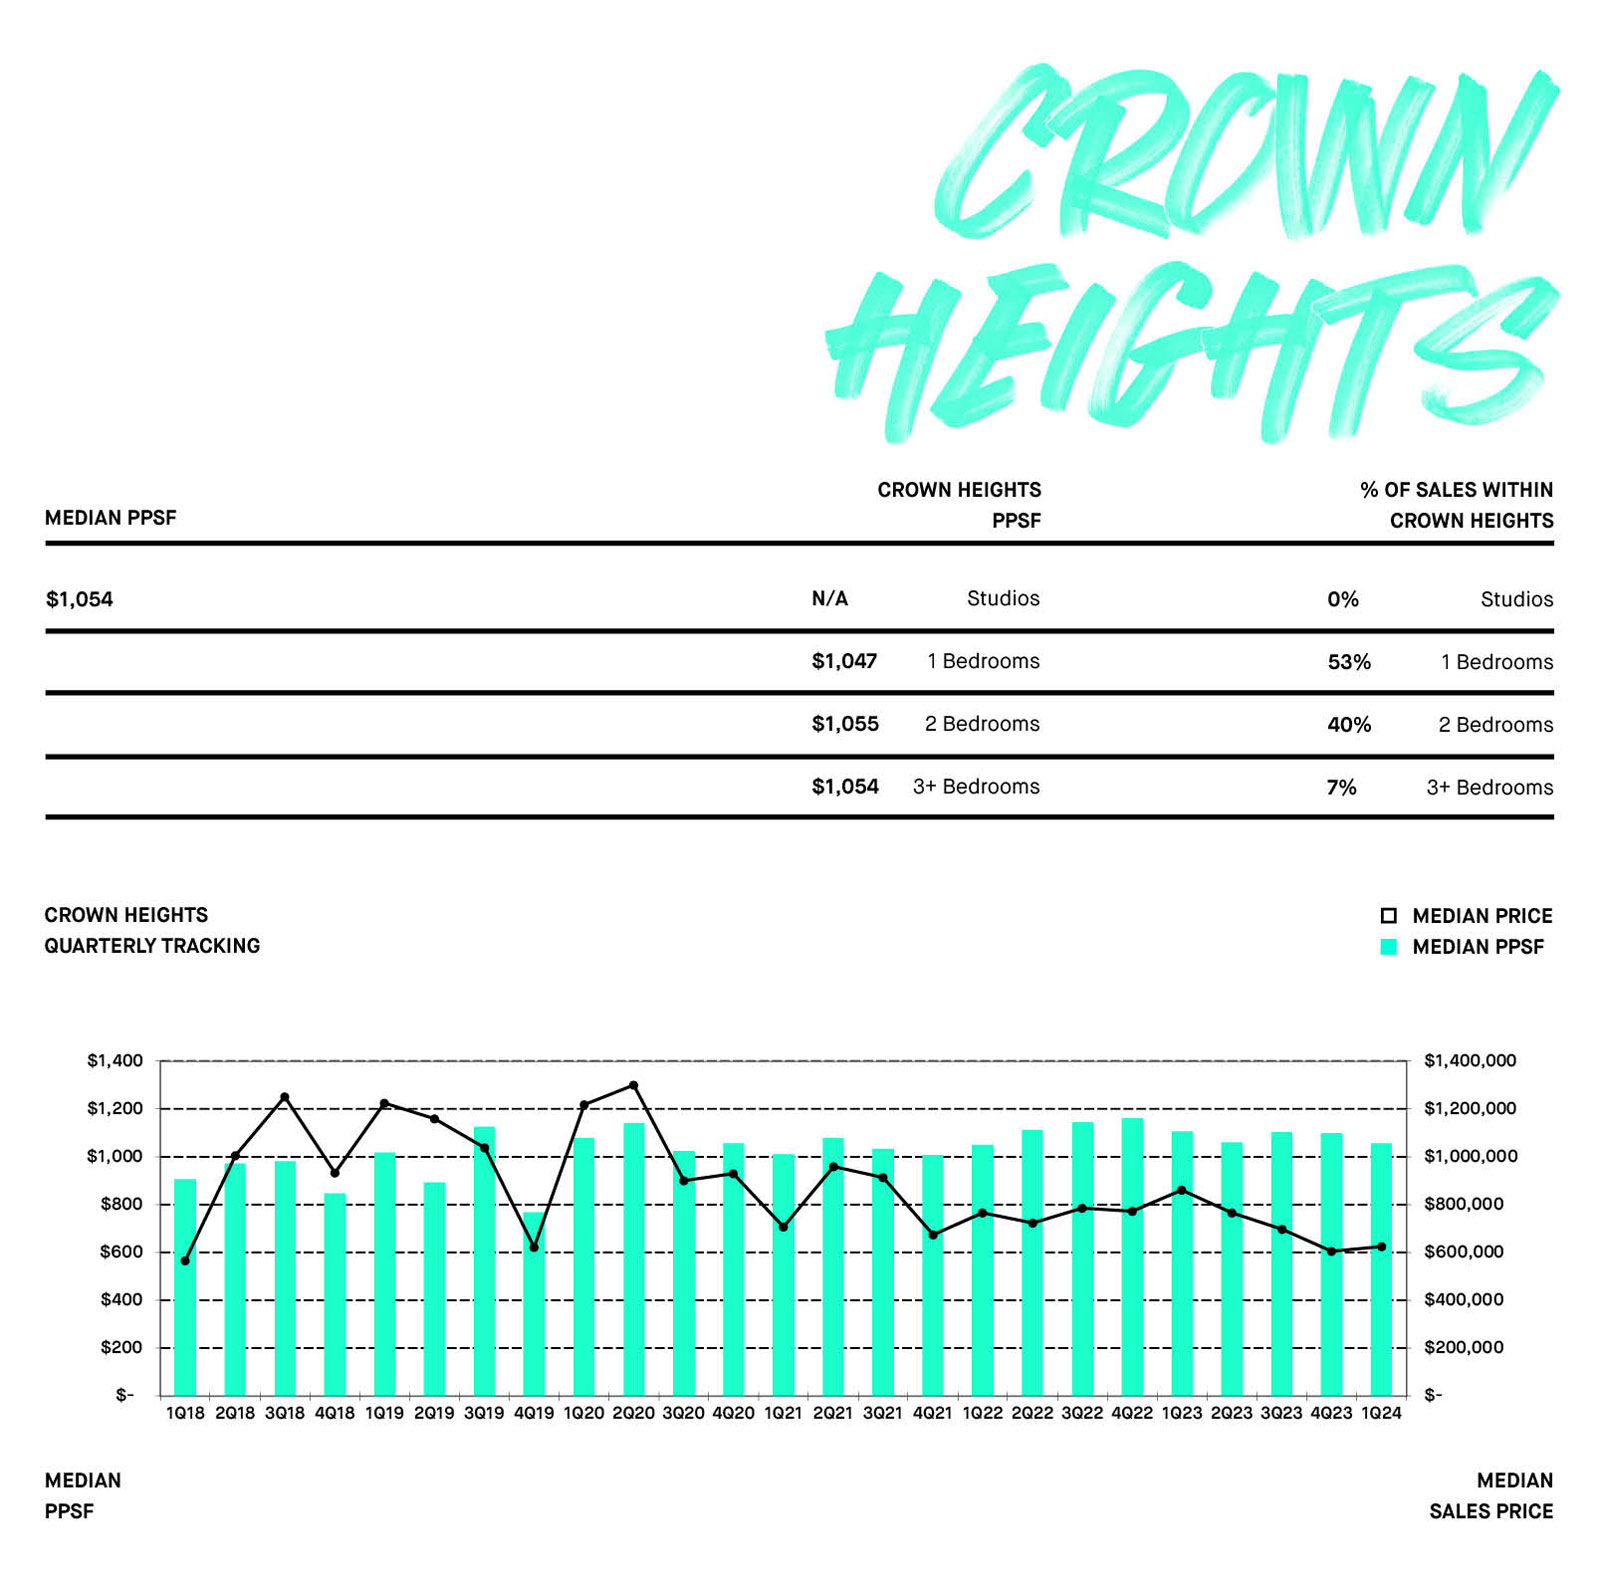
CROWN HEIGHTS
PPSF $1,054 from $1,099
Sales Price $625,000 from $605,859
HIGHEST NEW DEVELOPMENT SALE PPSF
50 BRIDGE PARK DRIVE PH3A $2,542 PPSF
HIGHEST NEW DEVELOPMENT SALE
50 BRIDGE PARK DRIVE PH3A $9,030,000
MARKET SNAPSHOT
MARKET SUMMARY
Quarter-over-quarter, total new development sales volume in Brooklyn increased by 46.77%, from $334,674,528 in 4Q23 to $491,217,935 in 1Q24, and the
total number of sponsor sales increased by 43.88% from 237 to 341. Quarter-over-quarter, the median price per square foot for increased by 8.2%, from
$1,287 to $1,392 as the median sales price paid decreased by 0.4%, from $1,200,000 to $1,195,000. Year-over-year, median price per square foot increased
by 10.4%, from $ 1,261 to $1,392 psf, and the median sales price increased by 14.6%, from $1,042,500 to $1,195,000.
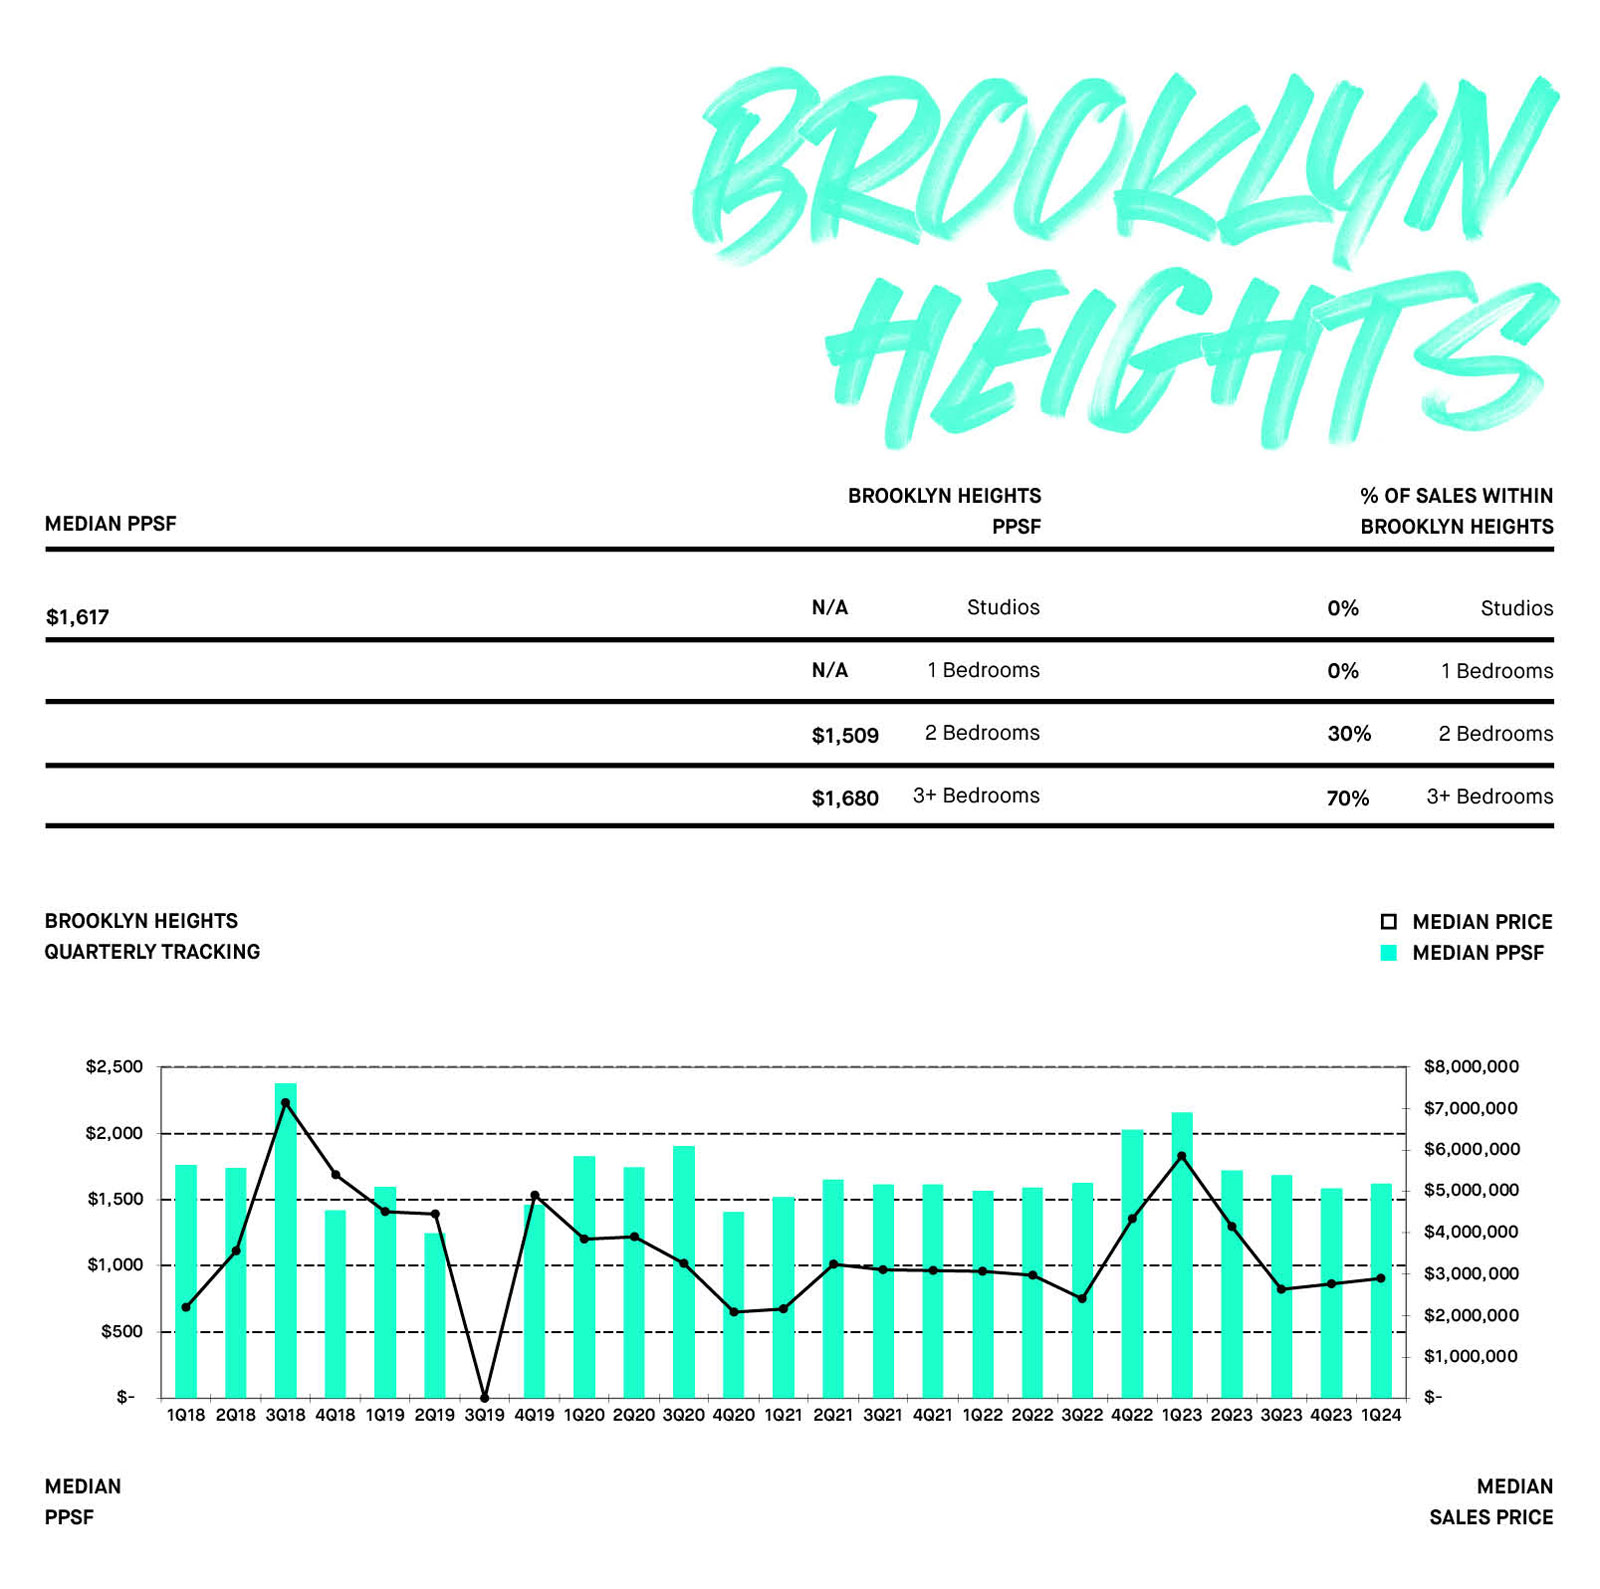
This past quarter, the highest sales price and the highest price per square foot paid both occurred at Quay Tower on 50 Bridge Park Drive in Brooklyn Heights
where unit PH3A sold for $9,030,000 ($2,542 psf).
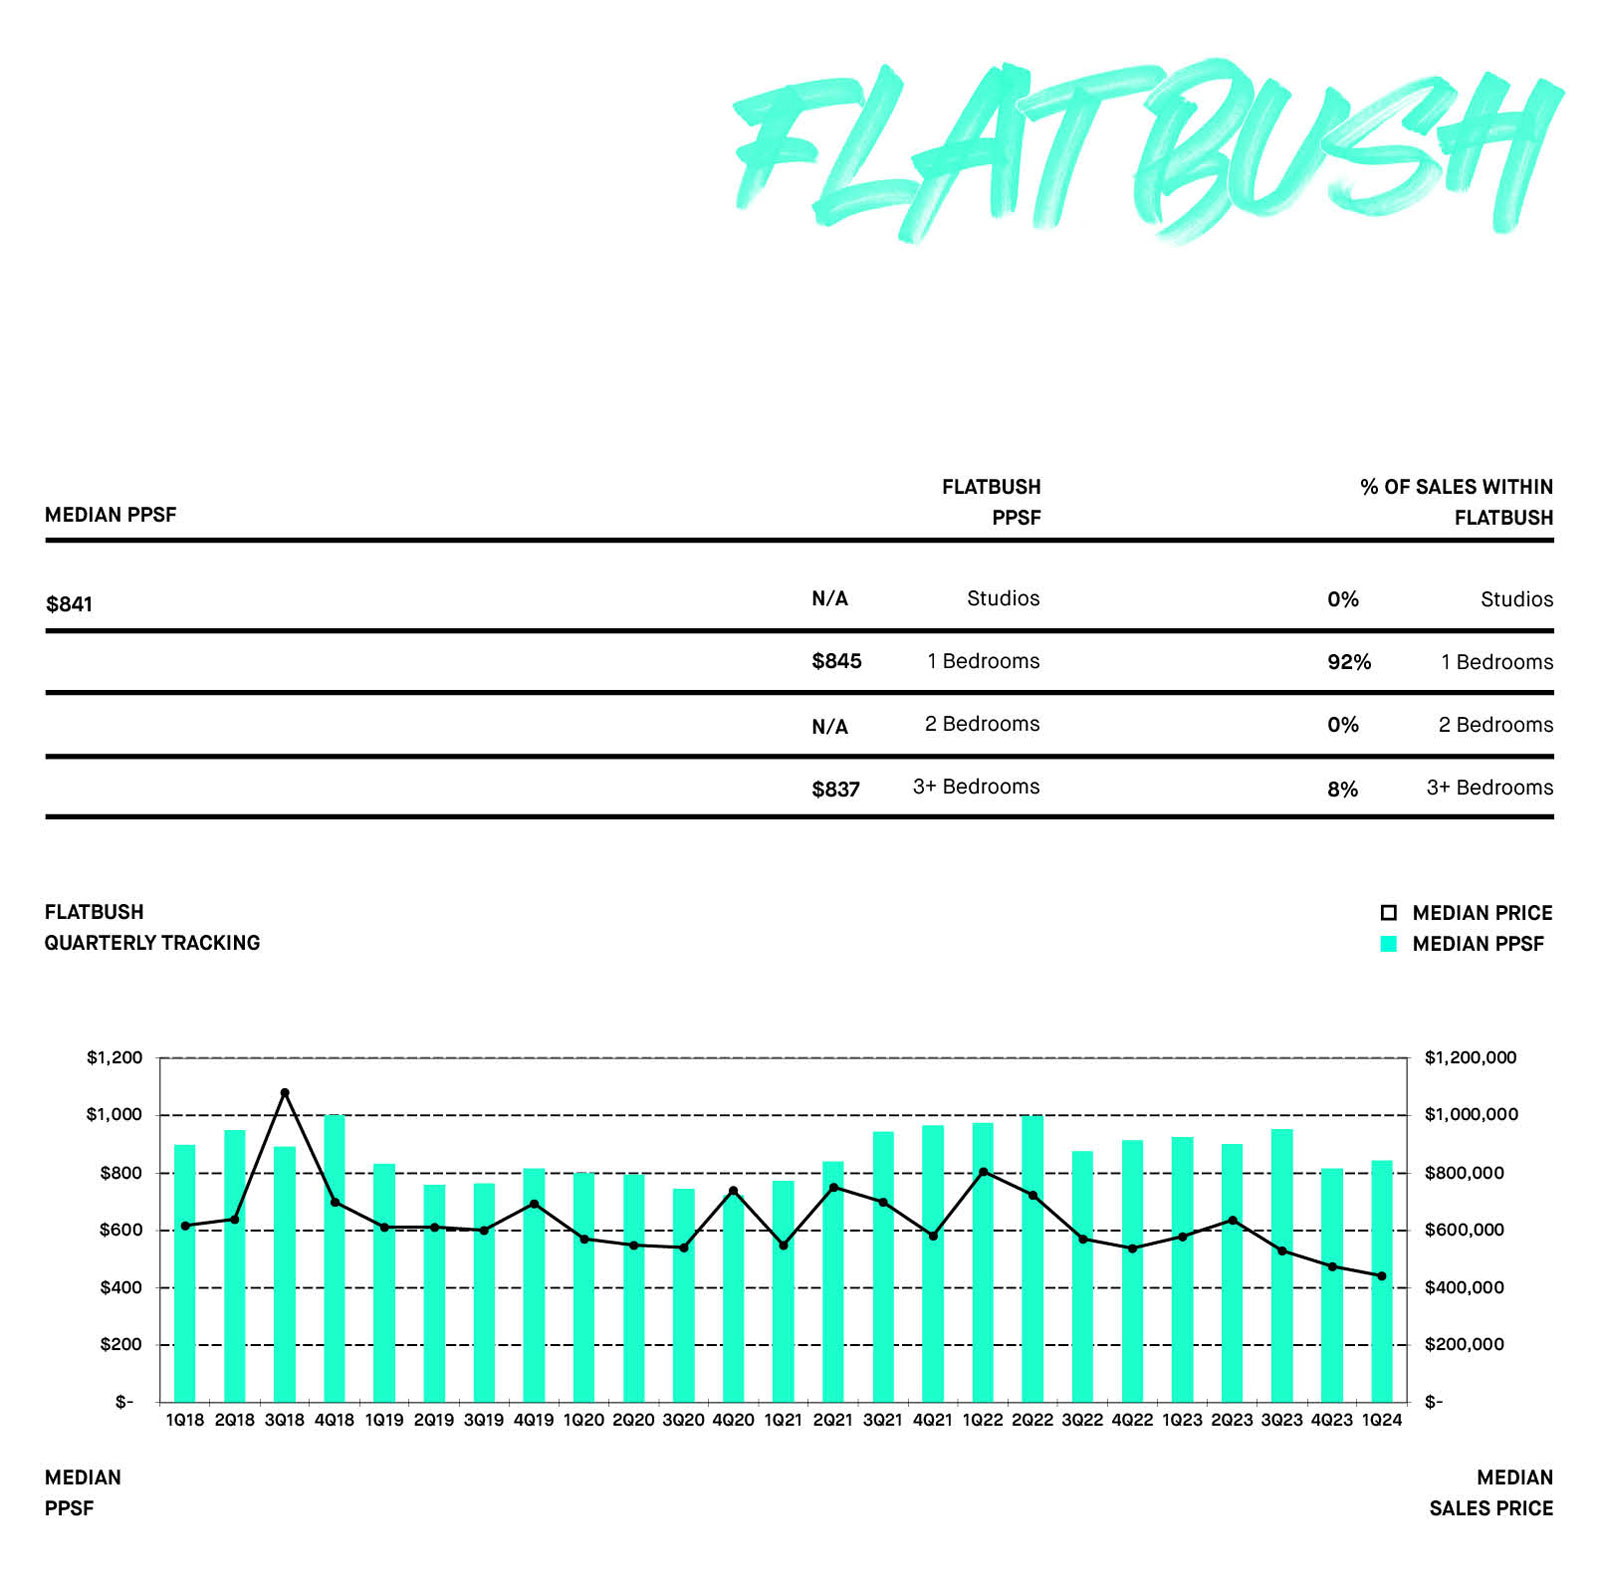
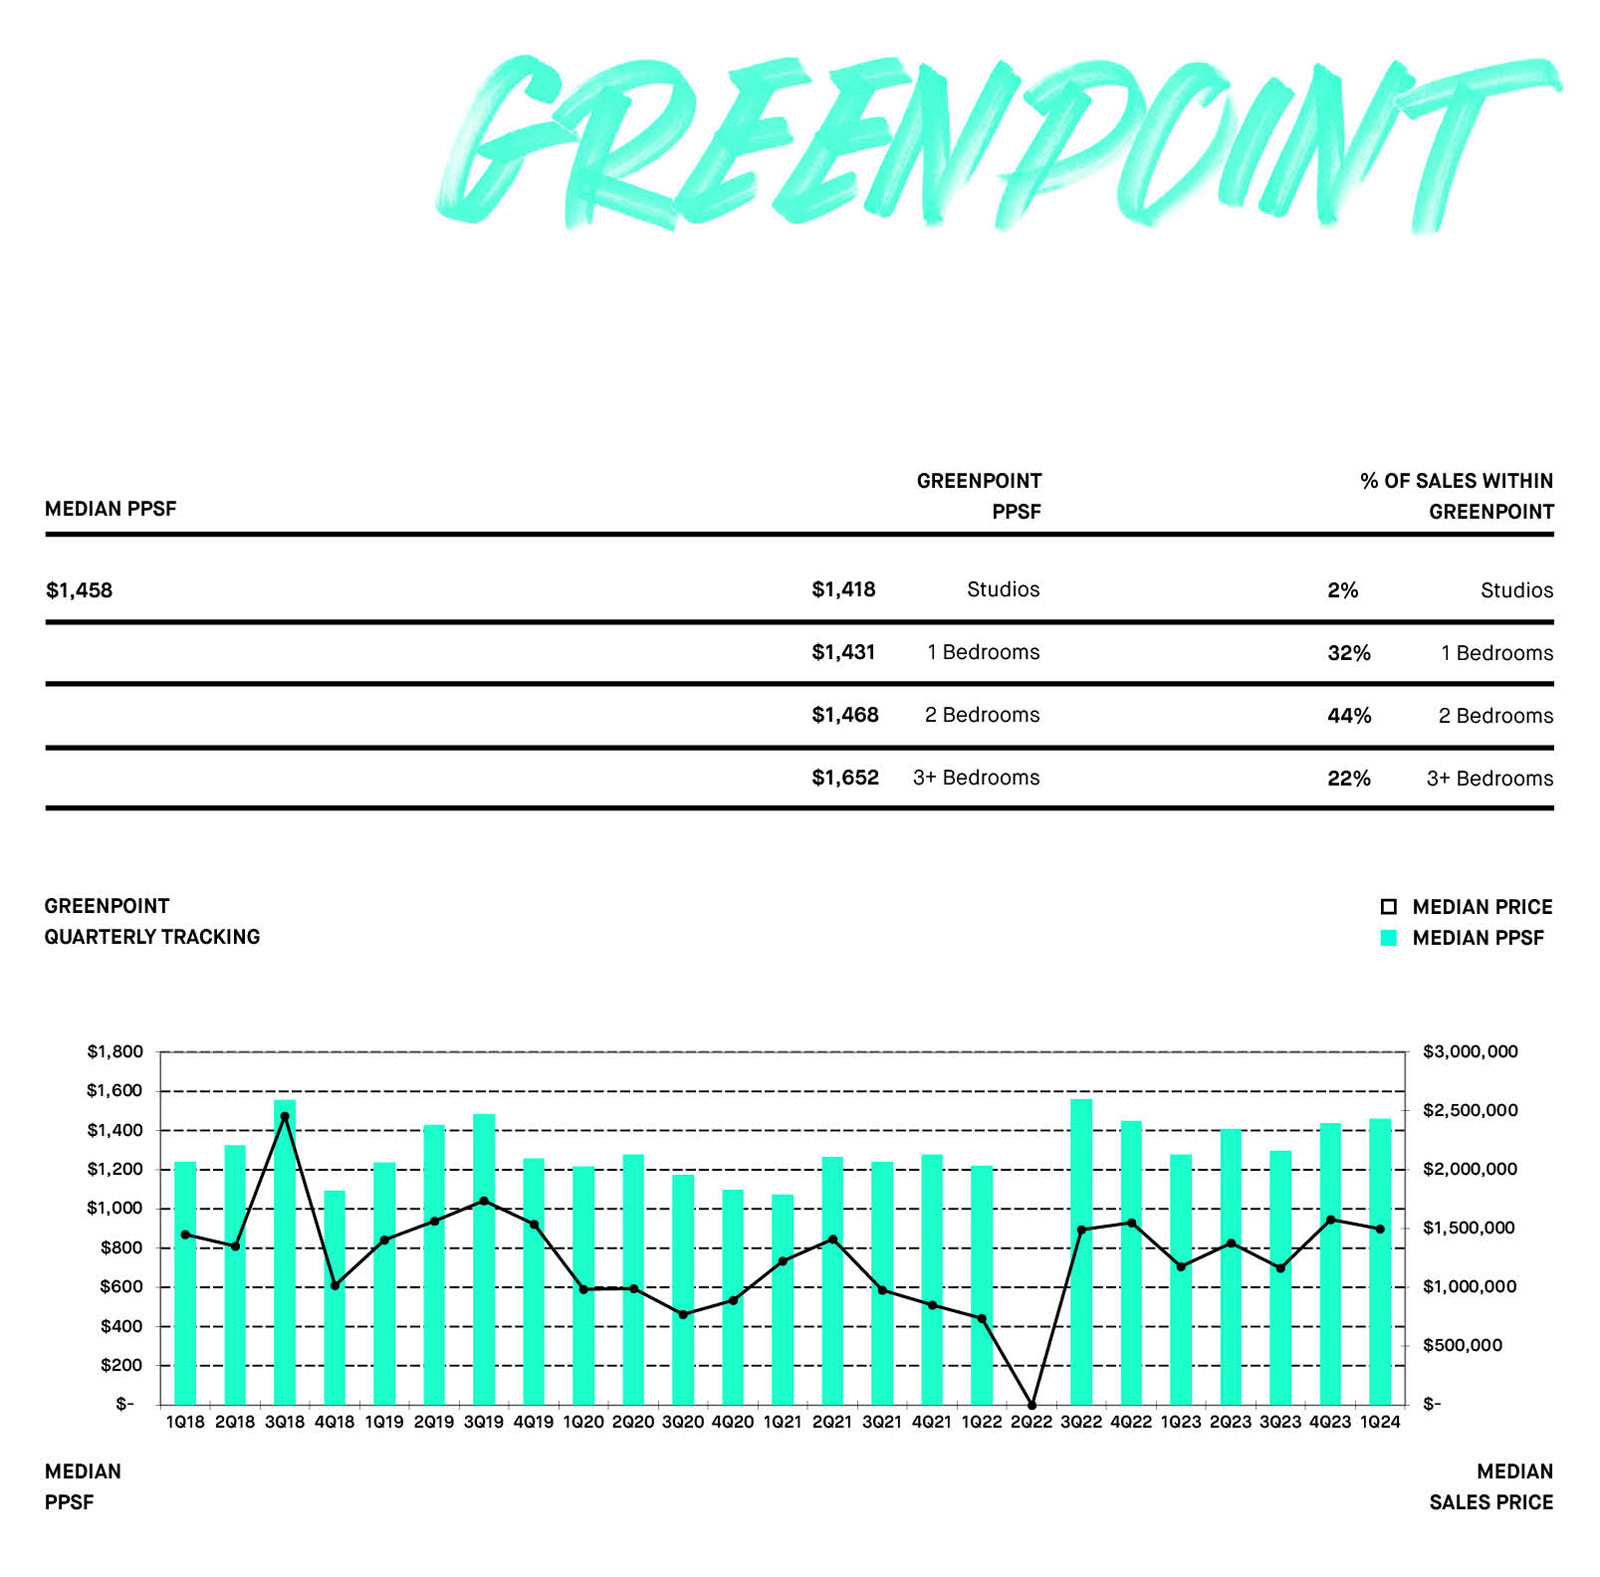
Greenpoint saw the largest percentage of Brooklyn Sponsor Sales closings this quarter at 18.48%, or 63 out of the 341 total closings.
MARKET UP-SWINGS
The largest quarterly up-swing by price per square foot occurred in Carroll Gardens / Red Hook, which increased by 50.1% from $1,158 psf to $1,739 psf, as the median sales price increased by 64.3%, from $1,694,586 to $2,785,000.
MARKET DOWN-SWINGS
The largest down-swing this quarter occurred in Crown Heights, where the median price per square foot decreased by 4.1%, from $1,099 psf to $1,054 psf, as the median sales price increased by 3.2%, from $605,859 to $625,000.
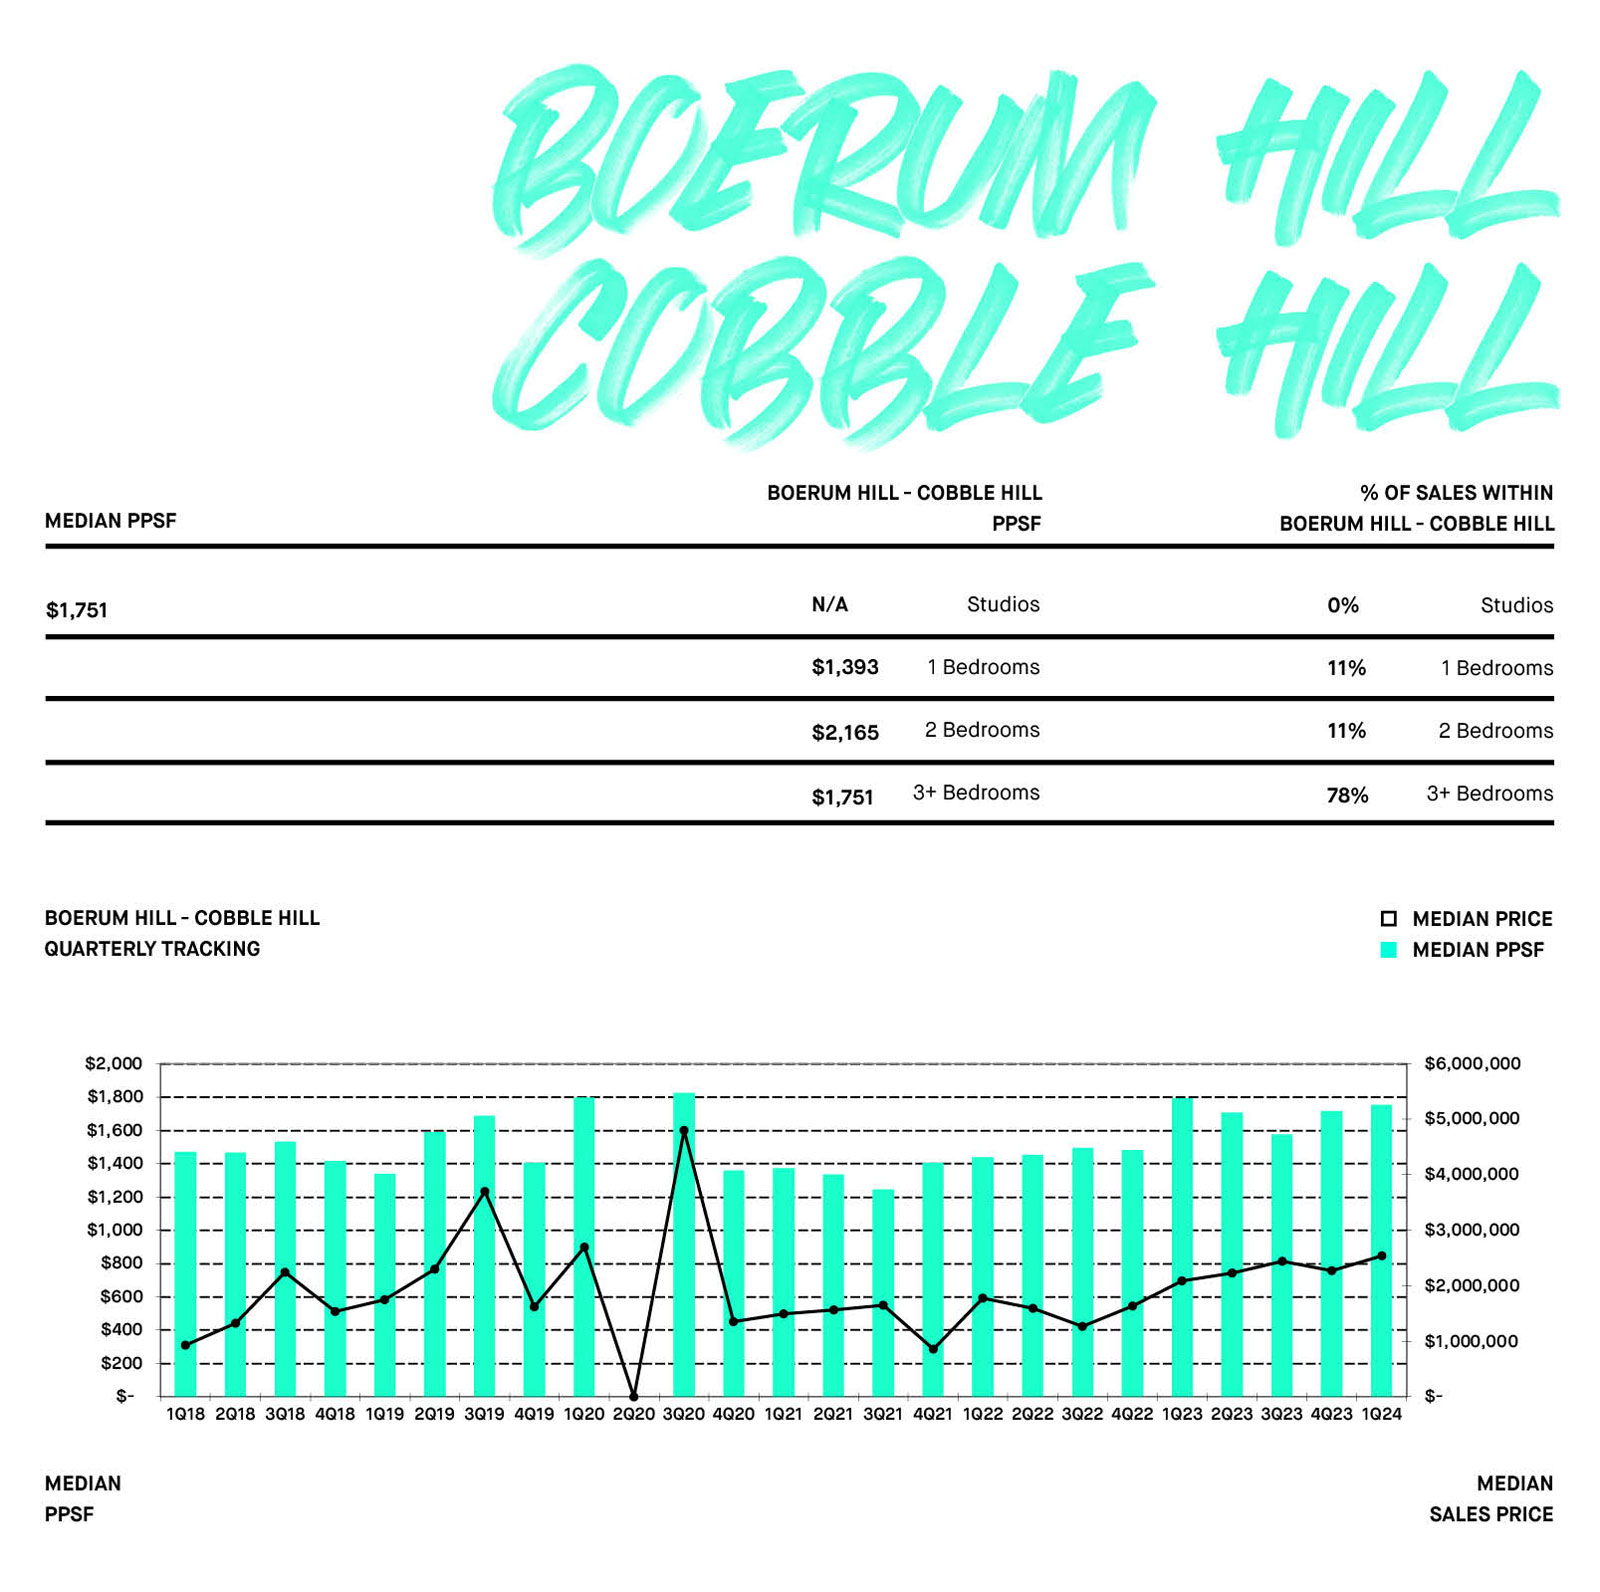
MARKET TRENDS
During the first quarter of 2024, there were 5 studio units that closed, representing 1.47% of the 341 total sponsor unit sales in Brooklyn, 127 were one-bedrooms (37.24%), 130 were two-bedrooms (38.12%) and 79 were three-bedrooms+ (23.17%).
NEIGHBORHOODS WHERE THE MAJORITY OF EACH UNIT TYPE WAS SOLD IN 1Q24

40%
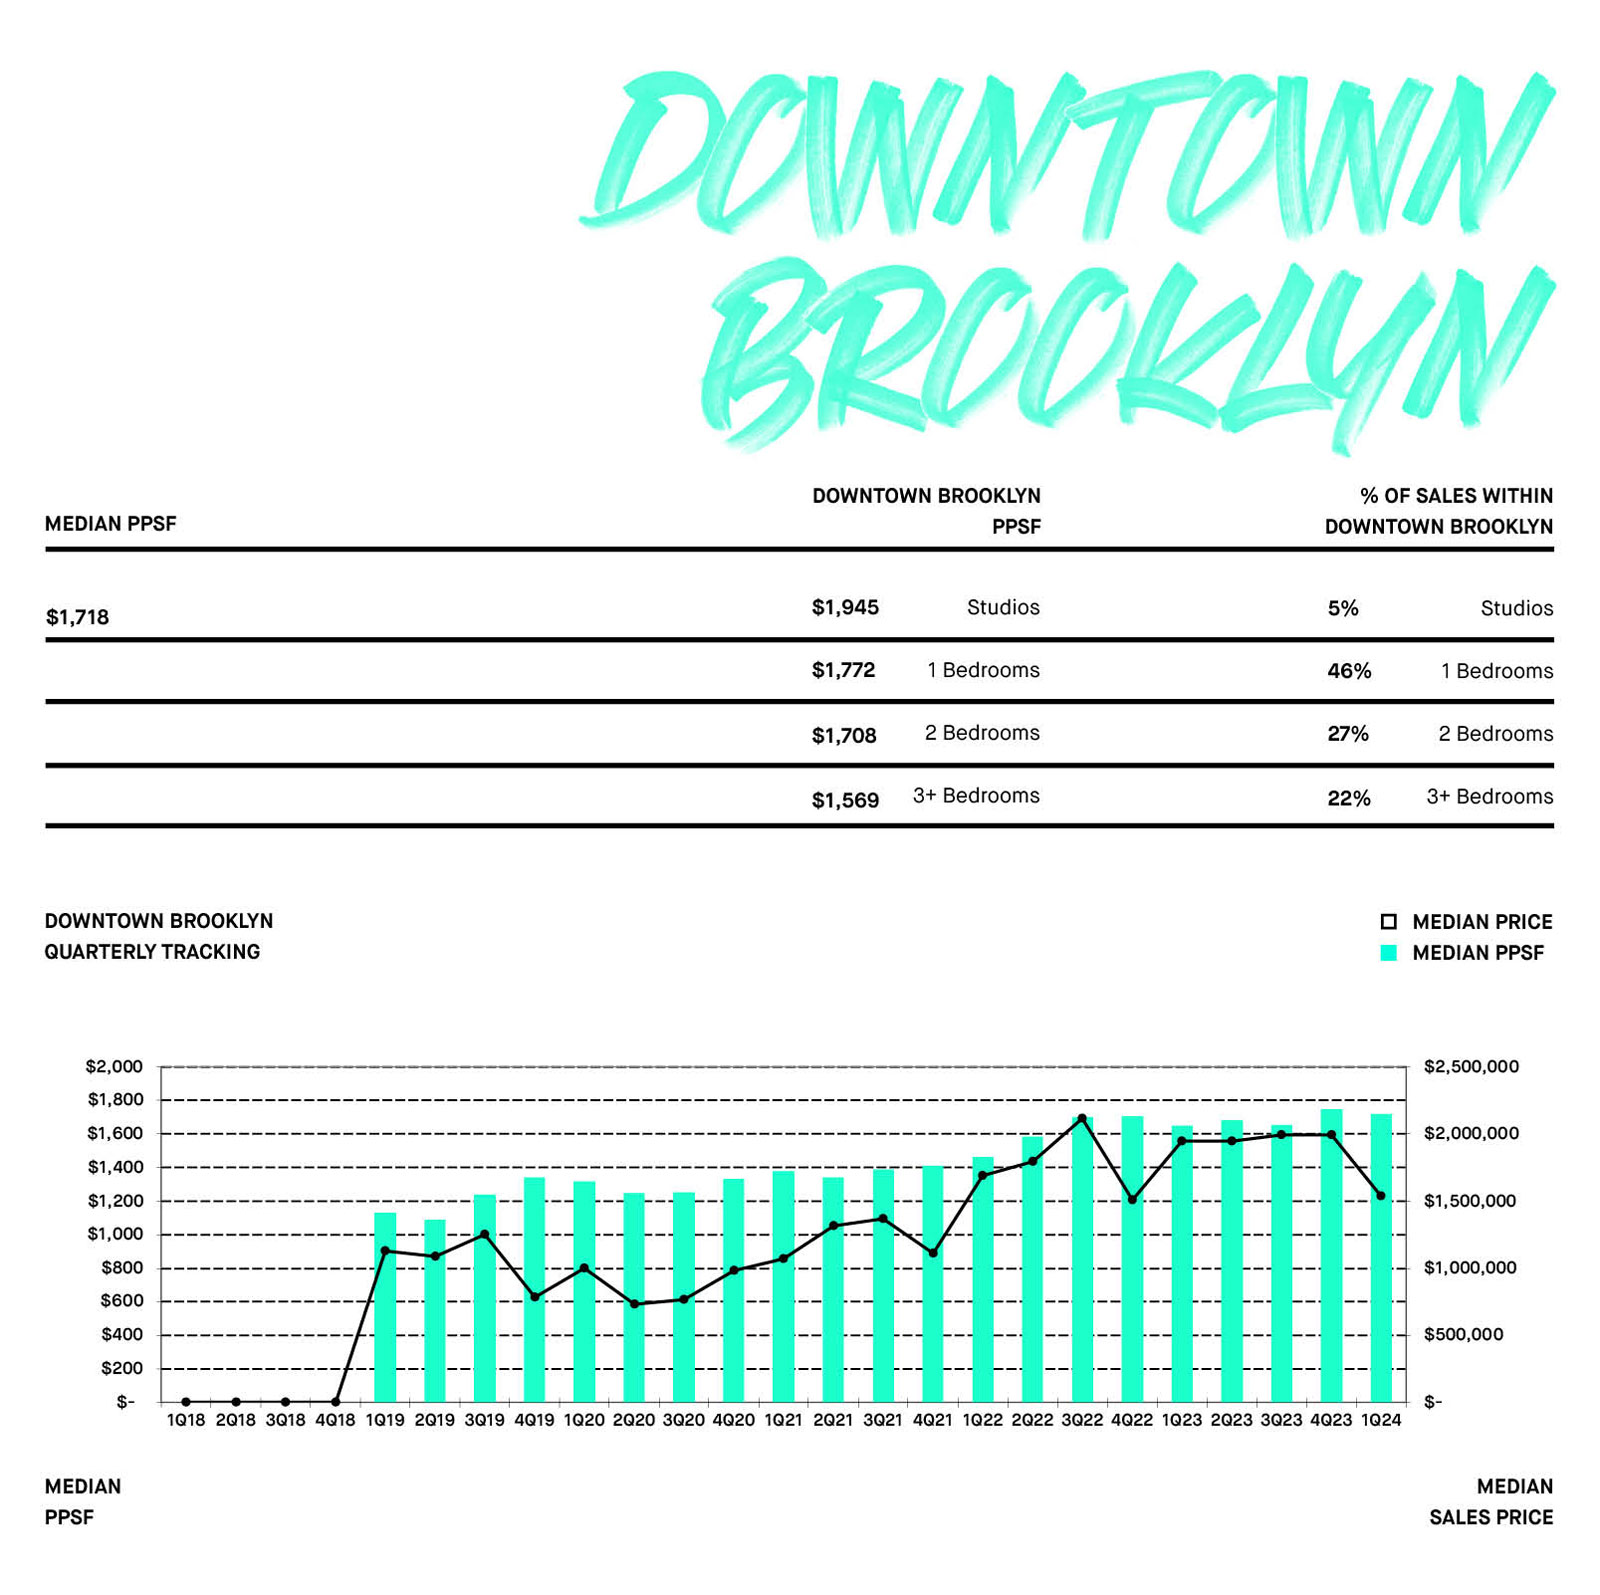
STUDIO
DOWNTOWN BROOKLYN
16%
ONE-BEDROOM
GREENPOINT
22%
TWO-BEDROOM
GREENPOINT
18%
THREE-BEDROOM+
GREENPOINT
MARKET SNAPSHOT

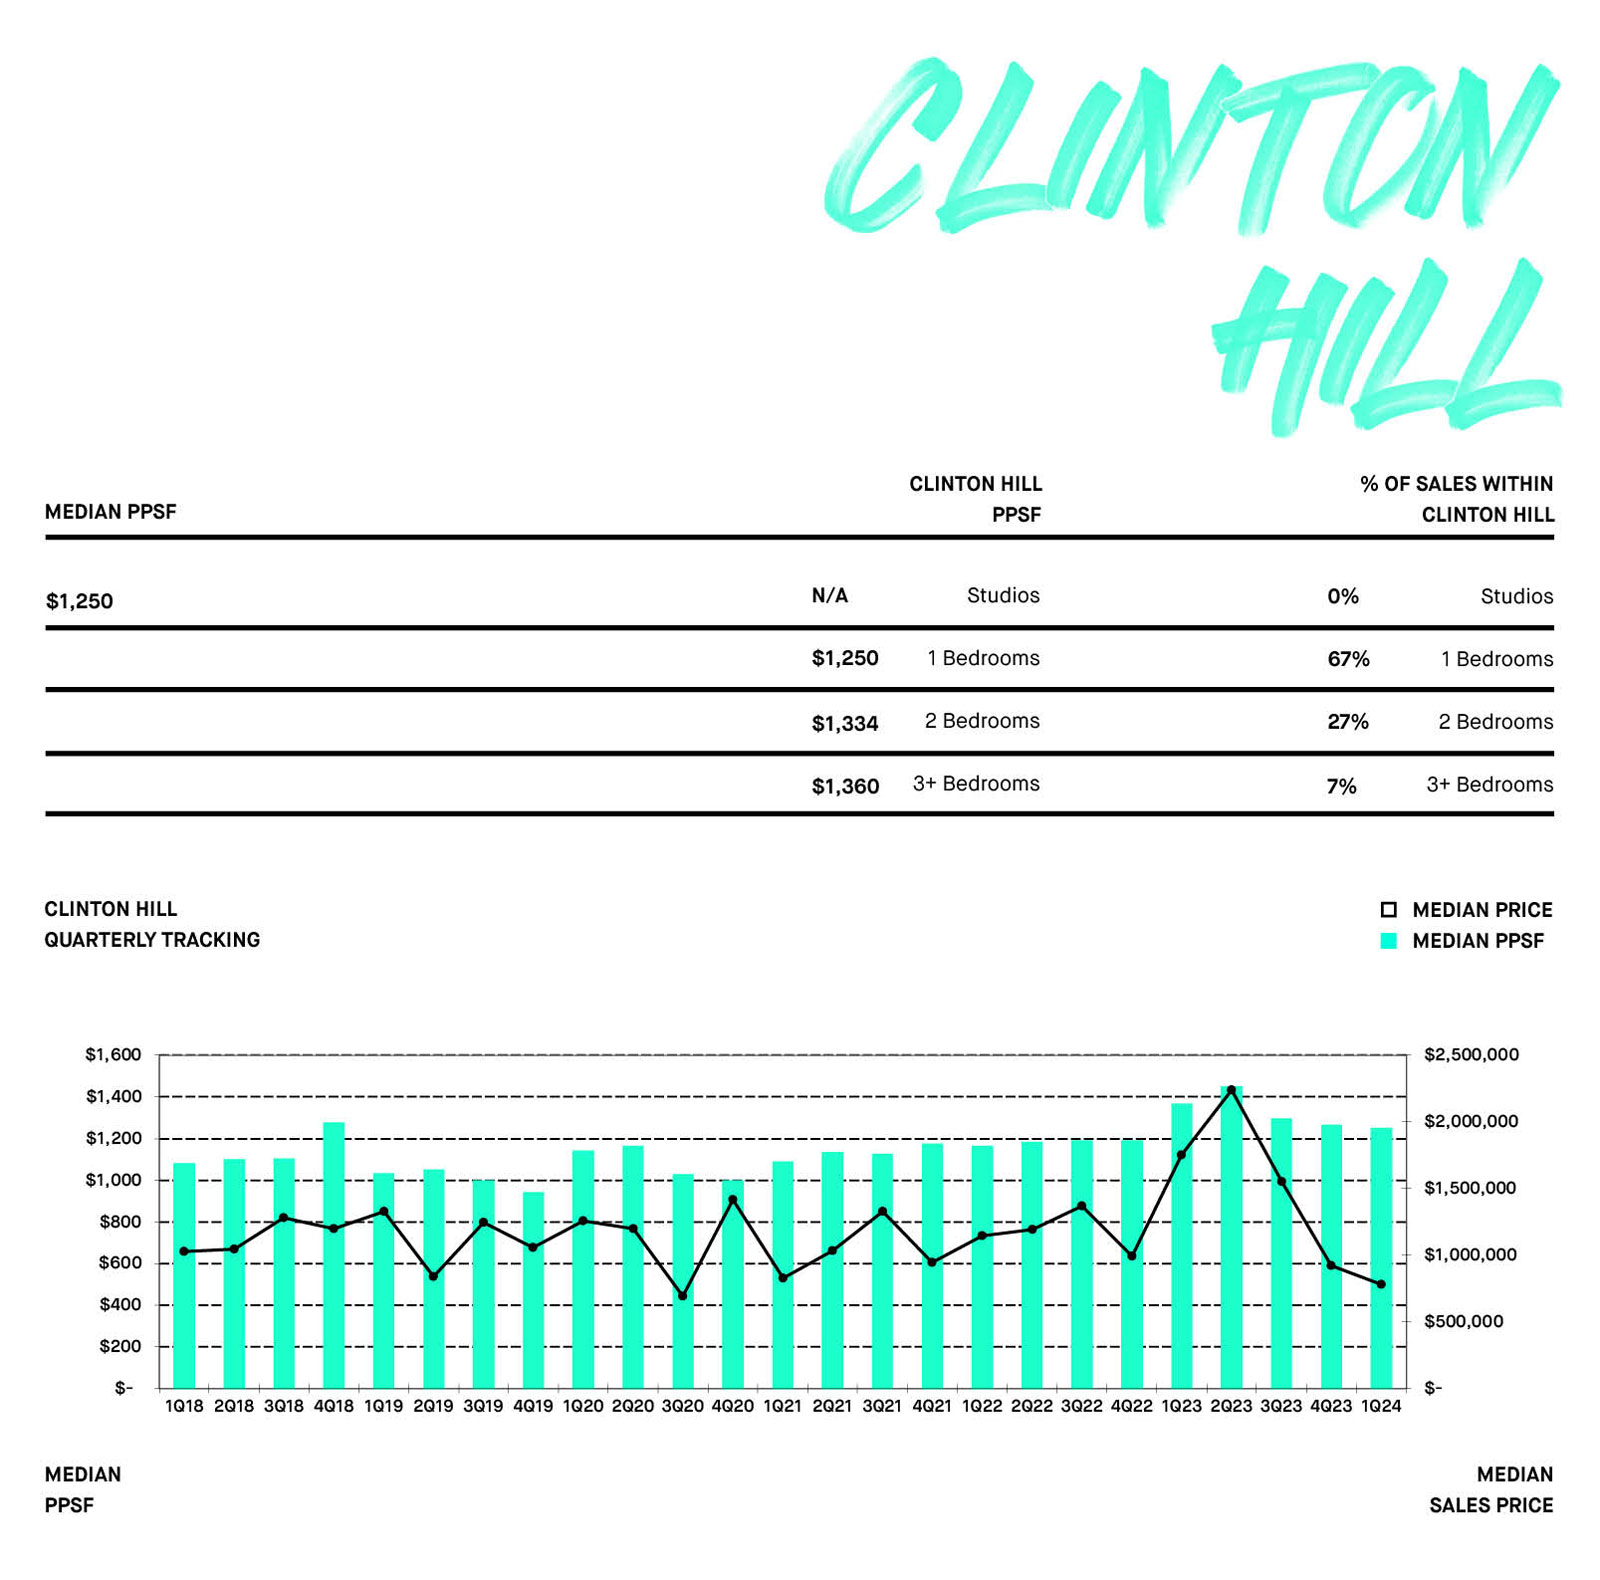
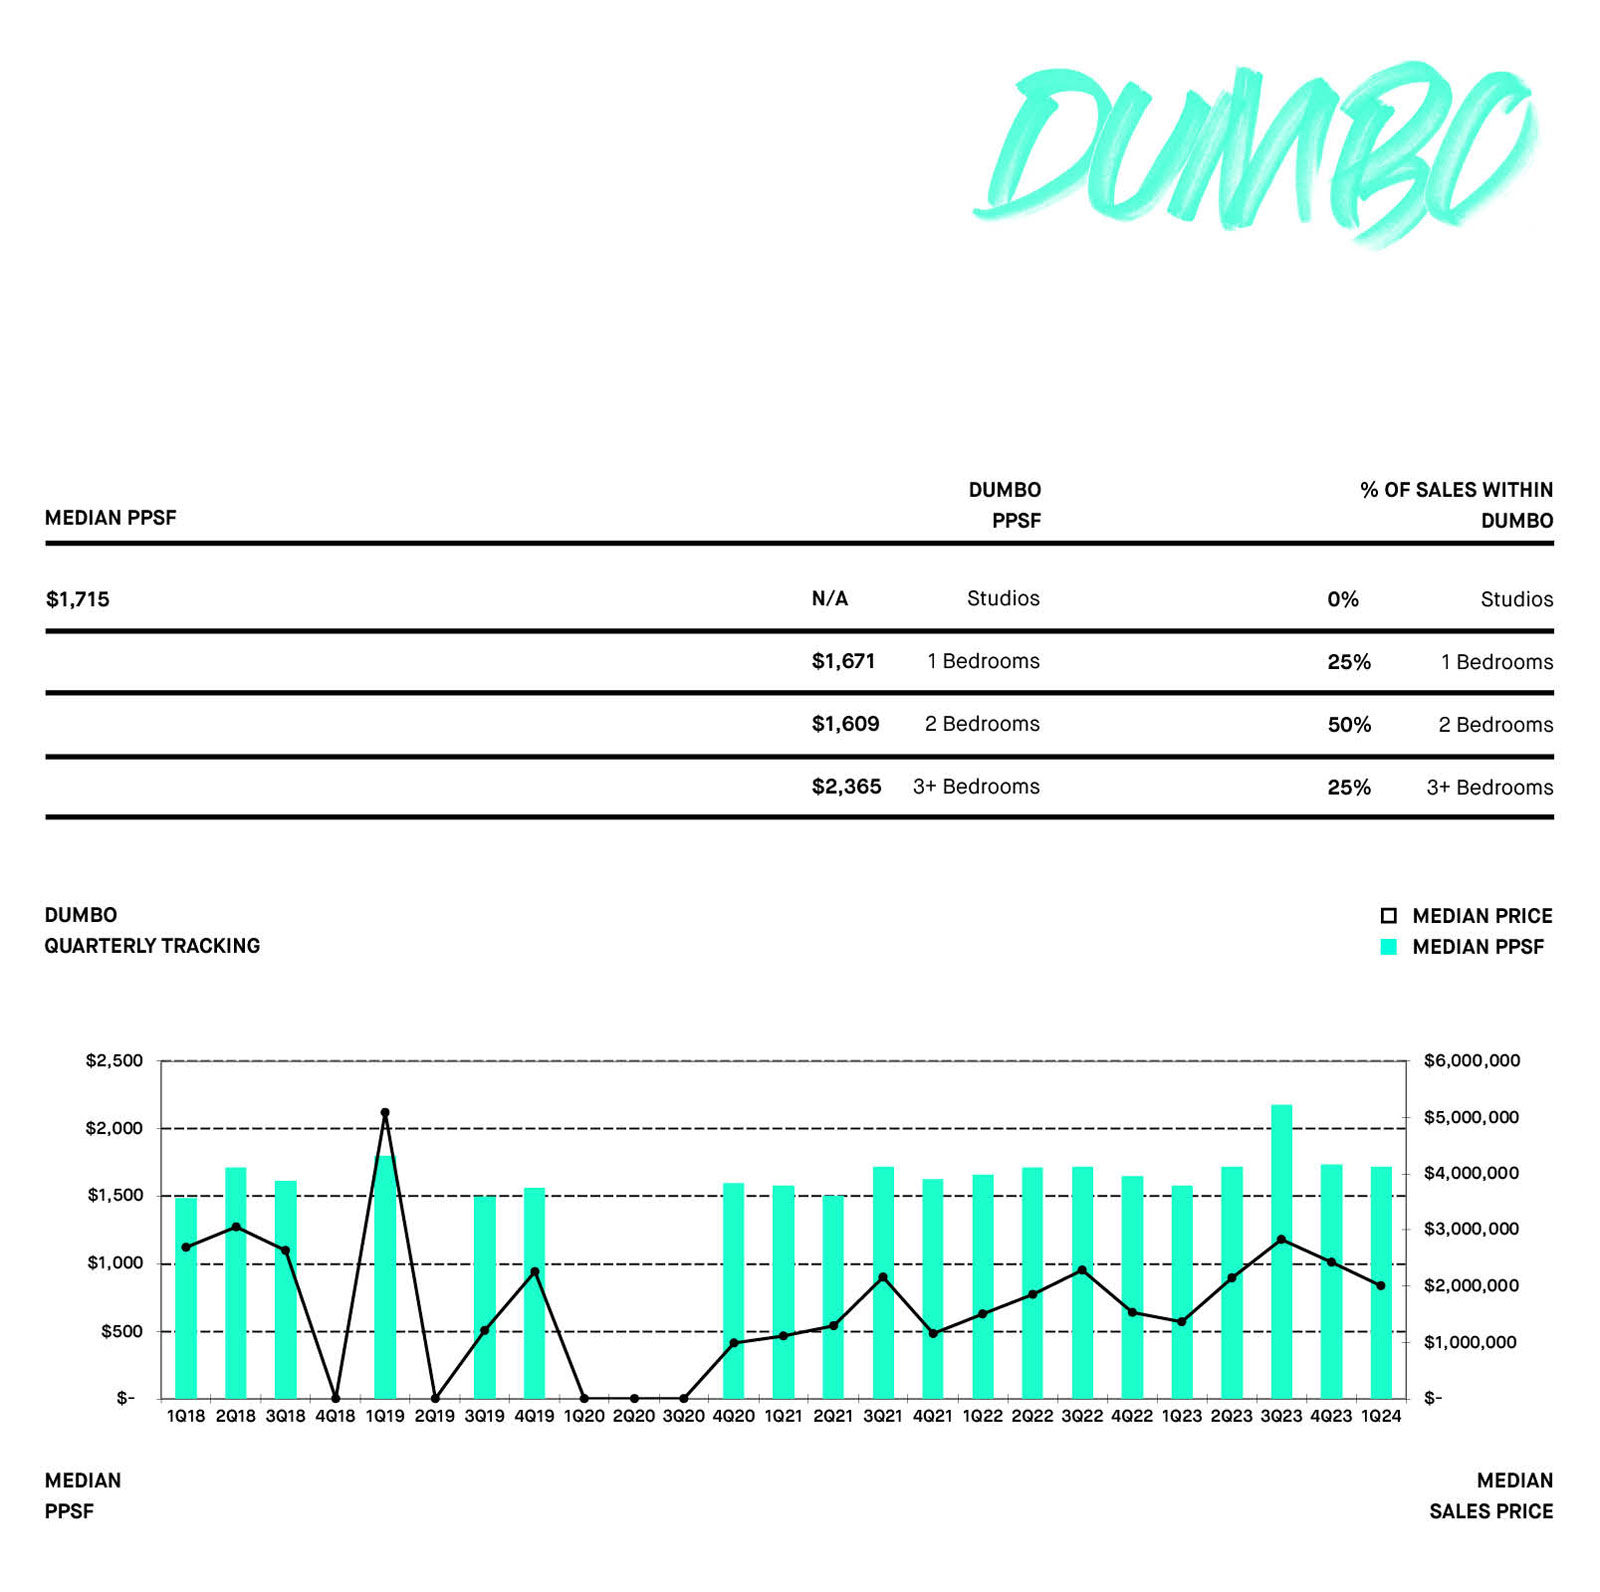
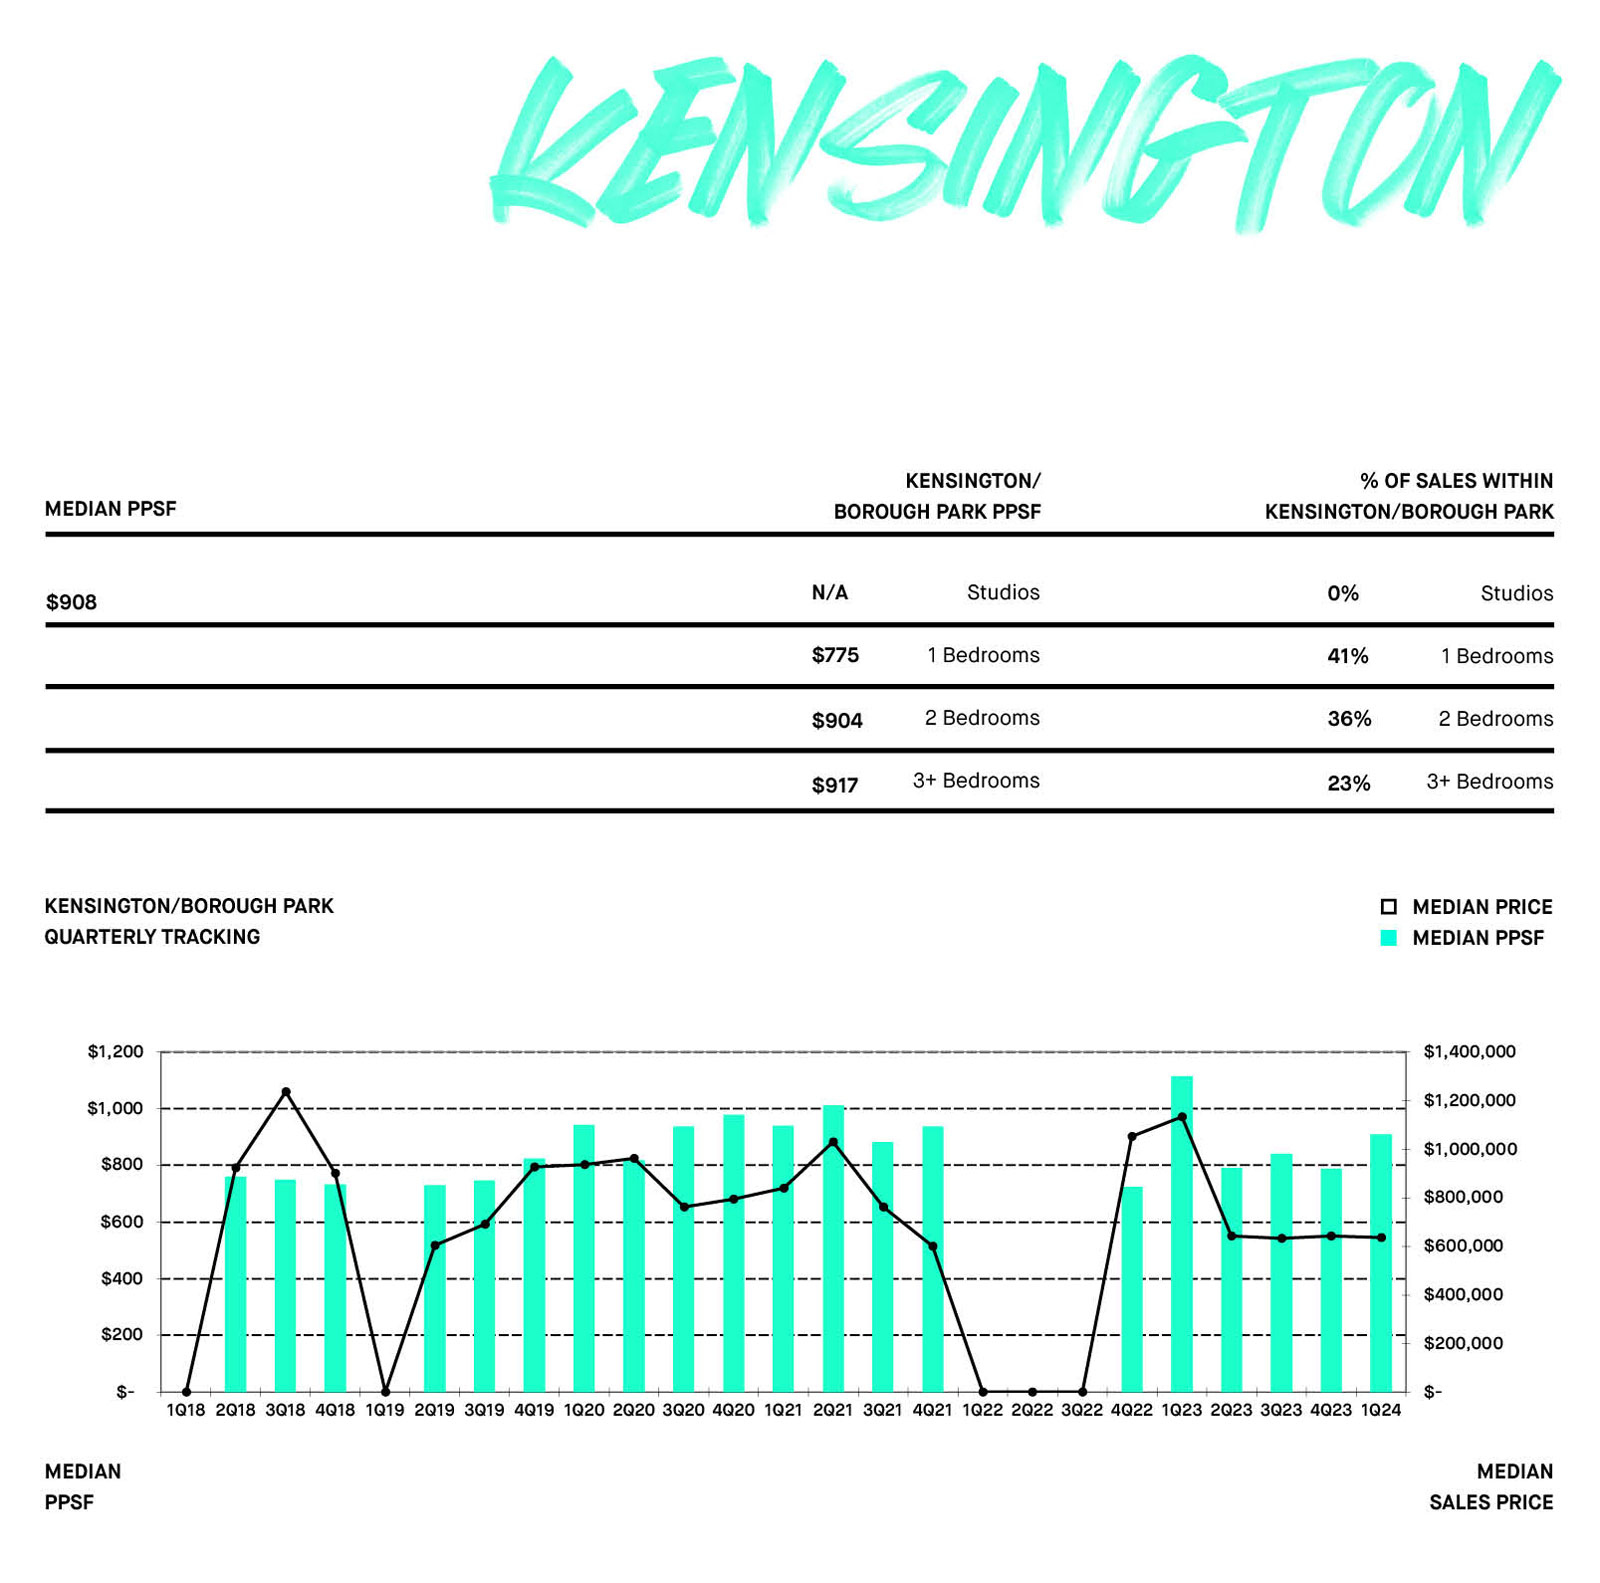
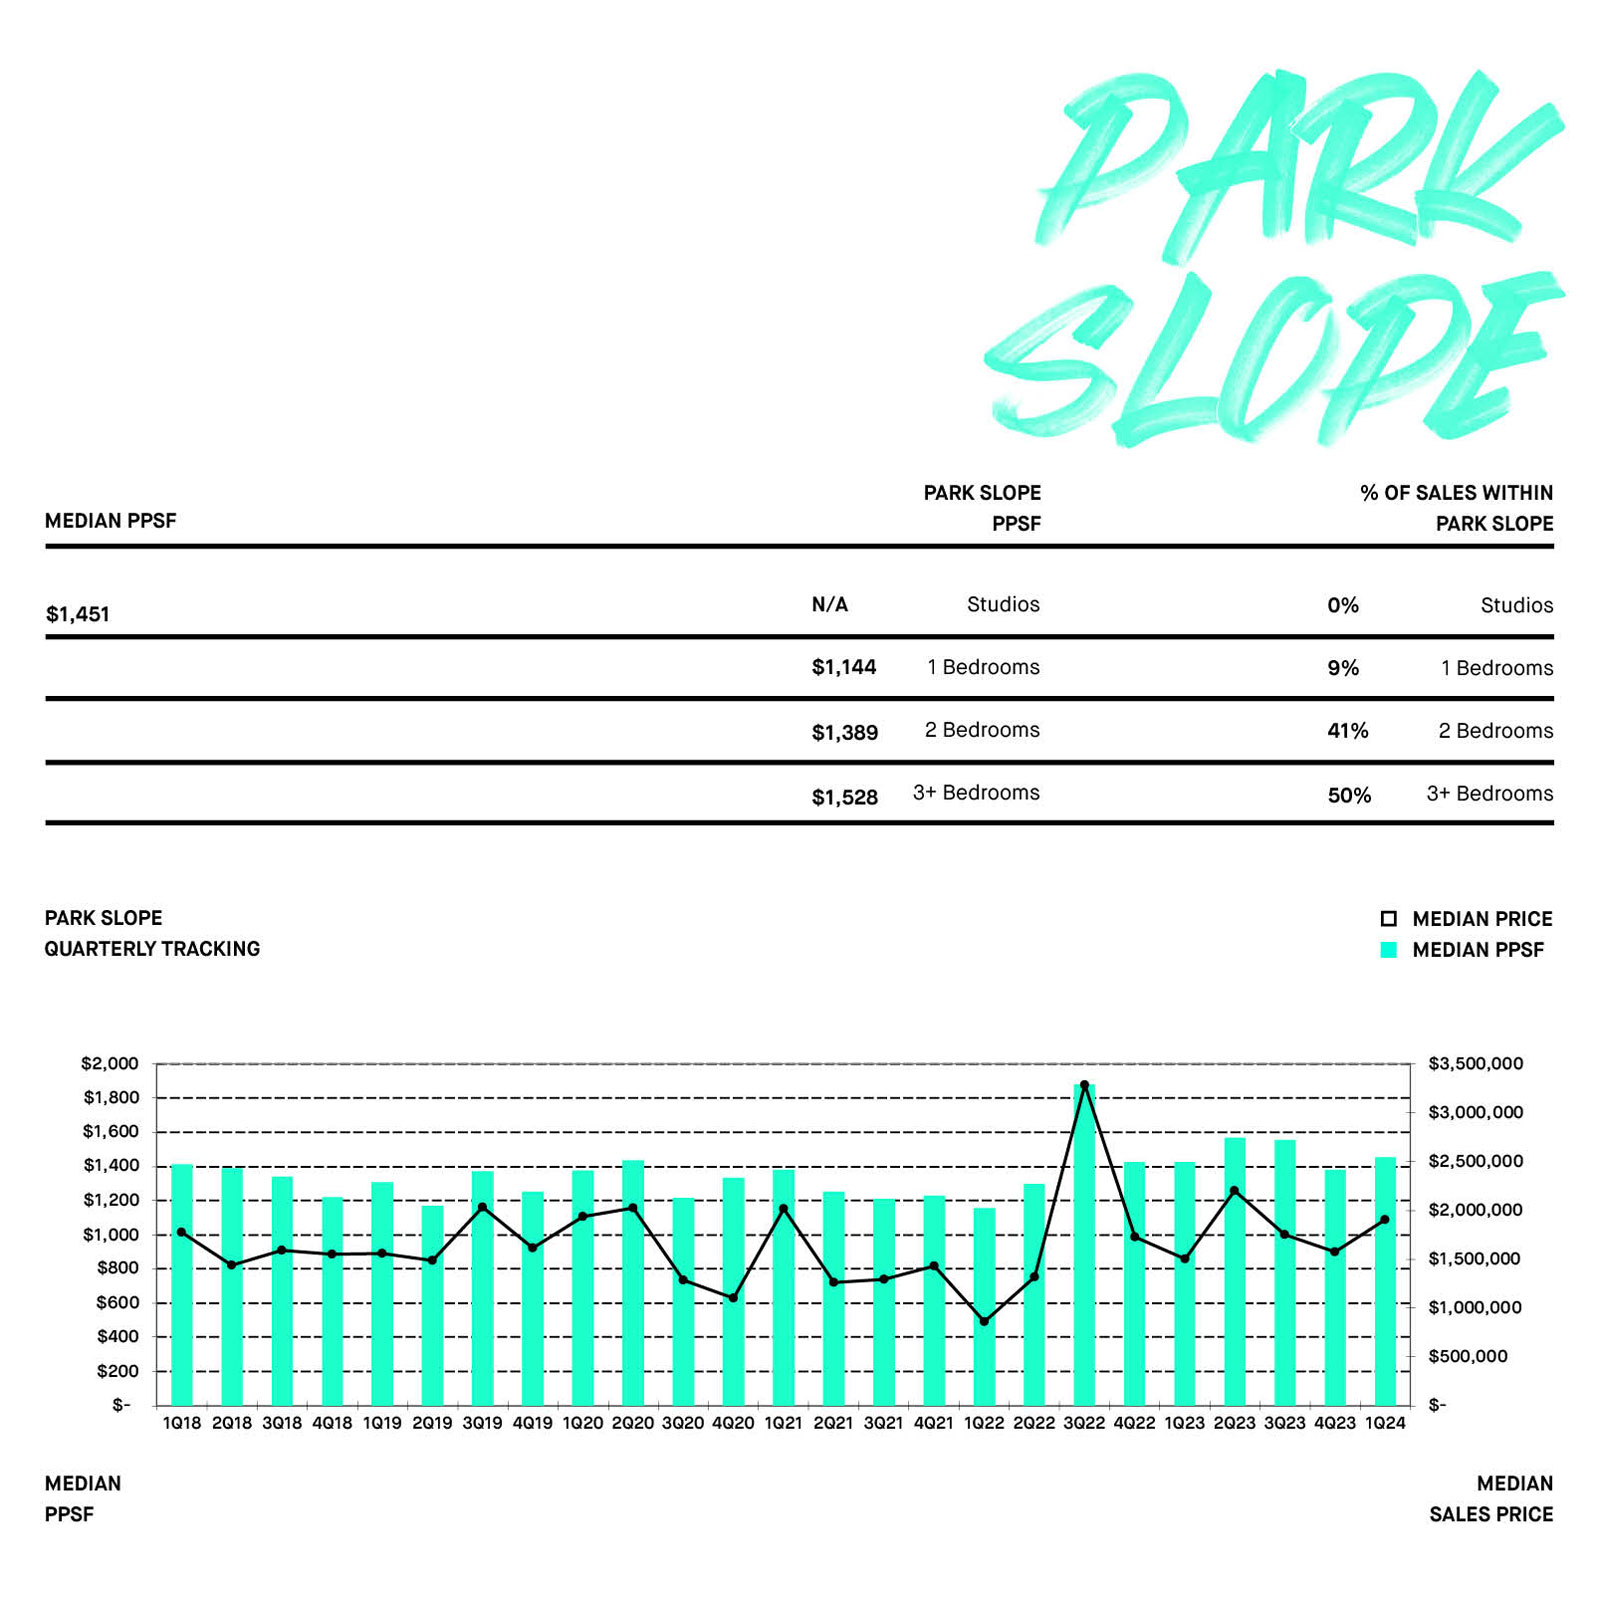
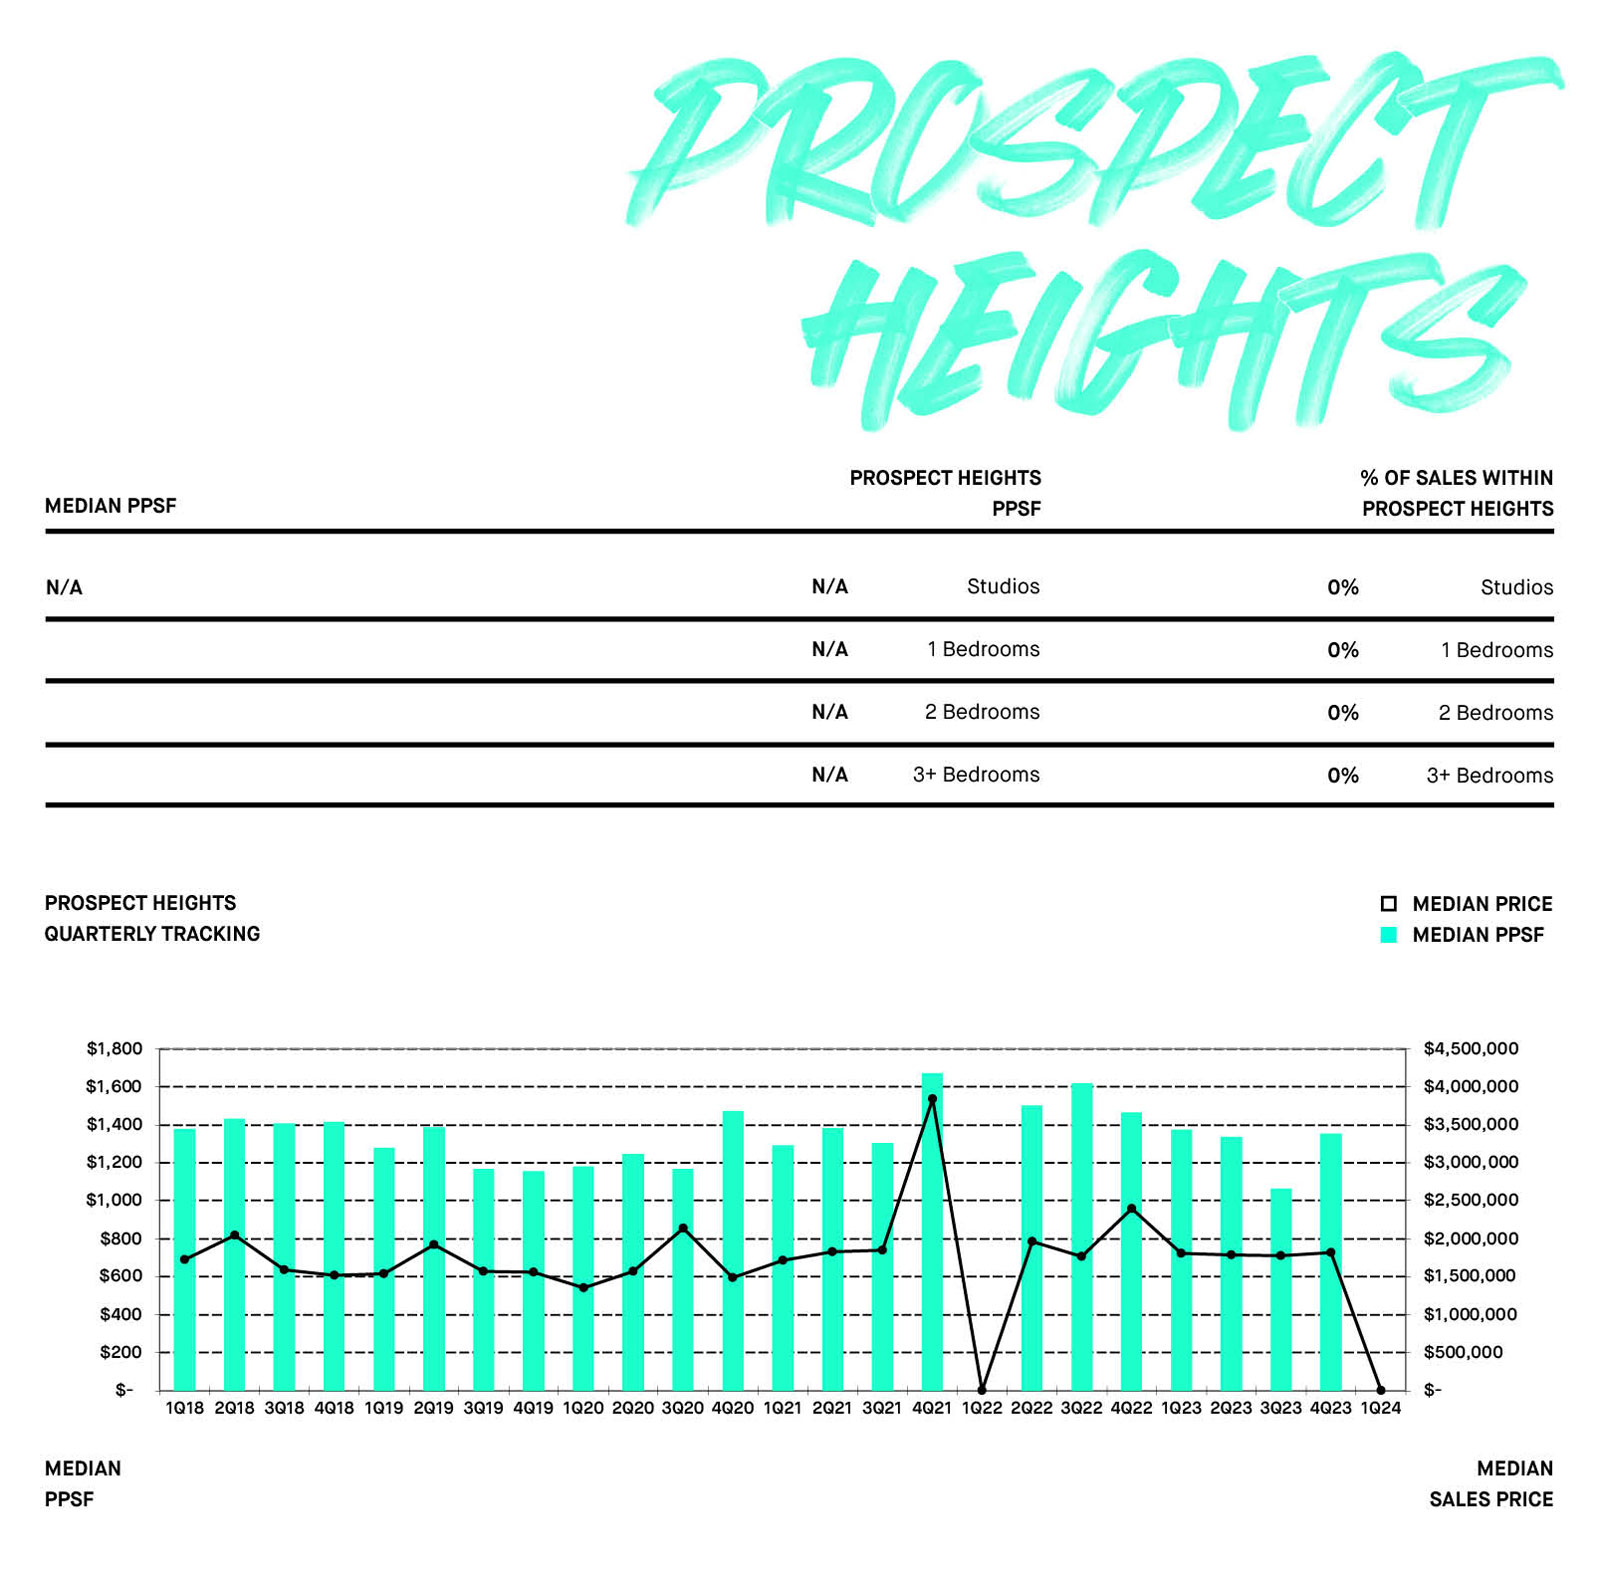
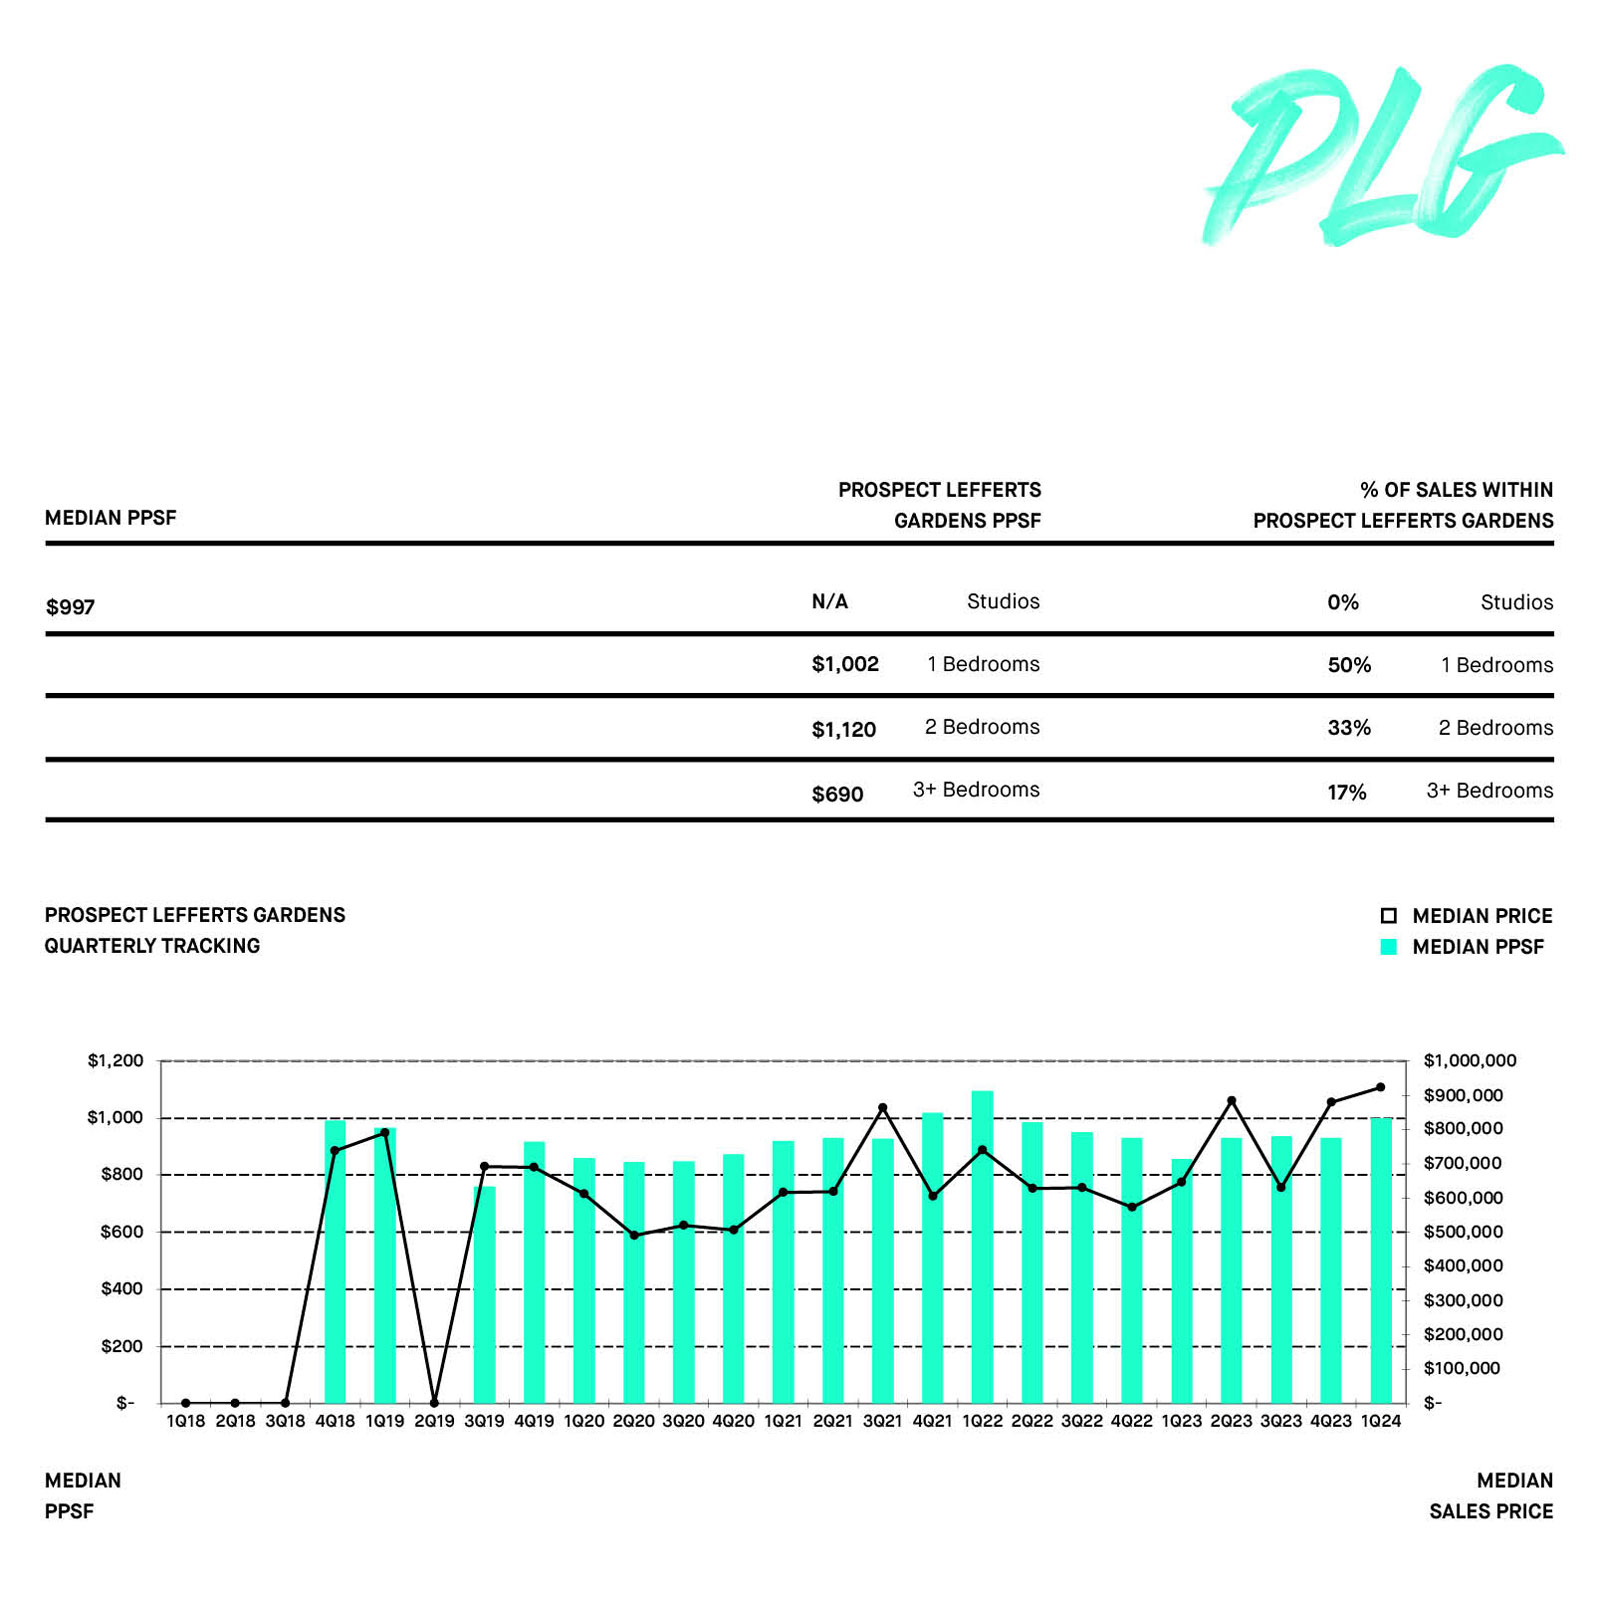
1Q24 MEDIAN PRICE PER SQUARE FOOT (PPSF) BY NEIGHBORHOOD

1Q24 MEDIAN SALES PRICE BY NEIGHBORHOOD

1Q24 % OF TOTAL SPONSOR SALES BOROUGH-WIDE

NUMBER OF UNITS SOLD IN 1Q24
THE REPORT EXPLAINED
INCLUDED IN THIS RESEARCH ARE WALK-UP AND ELEVATOR NEW DEVELOPMENT CONDOMINIUM BUILDINGS, AS WELL AS NEW CONVERSION CONDOMINIUMS IF THE SALES WERE APPLICABLE SPONSOR TRANSACTIONS. EXCLUDED FROM THE REPORT ARE ALL COOPERATIVE SALES.
Unit types such as studios, one-bedrooms, and two-bedroom units are grouped by square footage ranges. Typically, studios are under 550 square feet, one-bedrooms range from 500-750 square feet, two-bedrooms from 800-1,000 square feet and three-bedrooms+ from 950 square feet to in excess of 1,500 square feet. Presented with a quarter-over quarter and year-over-year comparison, both city-wide and by neighborhood, MNS New Development ReportTM tracks the market trends throughout Brooklyn and Brooklyn. MNS offers a unique insight into the new development market by tracking stalled construction sites on a quarterly basis, a great indicator of where development in general is moving. MNS is your source to find neighborhood price per square foot analysis, average sale prices, unit type sales trends, overall price movement, neighborhood inventory comparisons, and absorption rates.
Can’t find what you’re looking for? Ask MNS for more information at www.mns.com
Contact Us Now: 718.222.0211
Note: All market data is collected and compiled by MNS’ marketing department. The information presented here is intended for instructive purposes only and has been gathered from sources deemed reliable, though it may be subject to errors, omissions, changes or withdrawal without notice.
If you would like to republish this report on the web, please be sure to source it as the “Brooklyn New Development Report” with a link back to its original location